$282,900
3 bd|2 ba|1.2k sqft
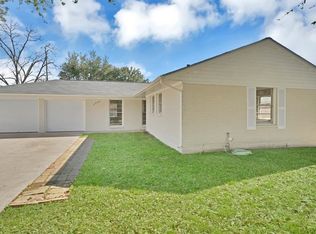
2007 Counter Point Dr, Houston, TX 77055
Off Market
Zillow last checked: 8 hours ago
Listing updated: November 14, 2025 at 10:36am
Fernando Chavira TREC #0777313 832-896-7615,
Casa Antigua Realty LLC
$325,700
$309,000 - $342,000
$1,770/mo
| Date | Event | Price |
|---|---|---|
| 11/14/2025 | Listed for sale | $340,000$269/sqft |
Source: | ||
| 10/15/2025 | Listing removed | $340,000$269/sqft |
Source: | ||
| 10/10/2025 | Listed for sale | $340,000-5.6%$269/sqft |
Source: | ||
| 9/16/2025 | Listing removed | $360,000$285/sqft |
Source: | ||
| 9/6/2025 | Listed for sale | $360,000$285/sqft |
Source: | ||
| 1/26/2024 | Listing removed | -- |
Source: | ||
| 10/10/2023 | Price change | $360,000-2.7%$285/sqft |
Source: | ||
| 9/26/2023 | Listed for sale | $370,000+2.8%$293/sqft |
Source: | ||
| 11/1/2022 | Listing removed | -- |
Source: | ||
| 8/19/2022 | Listed for sale | $360,000+18%$285/sqft |
Source: | ||
| 8/17/2022 | Price change | $2,200-8.3%$2/sqft |
Source: | ||
| 8/5/2022 | Listed for rent | $2,400$2/sqft |
Source: | ||
| 6/1/2022 | Listing removed | -- |
Source: Better Homes and Gardens Gary Greene Report a problem | ||
| 5/21/2022 | Pending sale | $305,000$242/sqft |
Source: | ||
| 5/17/2022 | Price change | $305,000-4.4%$242/sqft |
Source: | ||
| 4/26/2022 | Price change | $319,000-1.8%$253/sqft |
Source: | ||
| 3/22/2022 | Listed for sale | $324,900+30%$257/sqft |
Source: | ||
| 11/29/2017 | Listing removed | $250,000$198/sqft |
Source: Keller Williams Realty #67544992 Report a problem | ||
| 10/24/2017 | Pending sale | $250,000$198/sqft |
Source: Houston Metropolitan #67544992 Report a problem | ||
| 10/14/2017 | Listed for sale | $250,000$198/sqft |
Source: Keller Williams Realty Metropolitan #67544992 Report a problem | ||
| Year | Property taxes | Tax assessment |
|---|---|---|
| 2025 | -- | $292,242 |
| 2024 | $3,296 +8.7% | $292,242 +1.6% |
| 2023 | $3,033 +38.2% | $287,638 +12.1% |
| 2022 | $2,194 | $256,542 +6.9% |
| 2021 | -- | $240,000 -3.6% |
| 2020 | -- | $248,854 +24.4% |
| 2019 | $1,896 -45.4% | $200,071 -6.9% |
| 2018 | $3,470 | $214,877 |
| 2017 | $3,470 +11% | $214,877 |
| 2016 | $3,126 +15.3% | $214,877 +24.6% |
| 2015 | $2,712 | $172,497 +12.7% |
| 2014 | $2,712 | $153,027 +22.7% |
| 2013 | -- | $124,738 |
| 2012 | -- | $124,738 |
| 2011 | -- | $124,738 |
| 2010 | -- | $124,738 |
| 2009 | -- | $124,738 -9.2% |
| 2007 | -- | $137,311 +7.1% |
| 2006 | -- | $128,184 +10% |
| 2005 | -- | $116,531 +0.6% |
| 2004 | -- | $115,800 +9.7% |
| 2003 | -- | $105,600 +20% |
| 2002 | -- | $88,000 |
| 2001 | -- | $88,000 +6.2% |
| 2000 | -- | $82,900 |
Find assessor info on the county website
Source: HAR. This data may not be complete. We recommend contacting the local school district to confirm school assignments for this home.