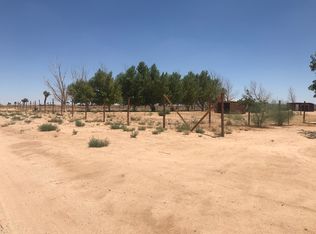
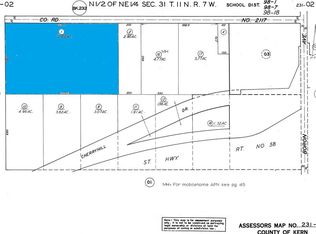
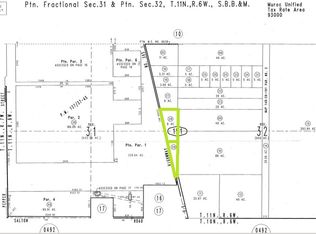
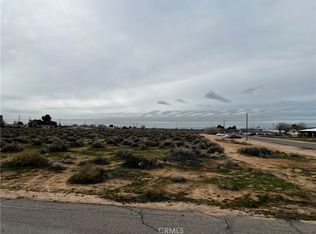
Opportunity to acquire two industrial parcels totaling approximately 53.7 acres in Boron. Comprised of 13.7 acres zoned M-2 and 40 acres zoned M-1 PD, this offering provides flexibility for a range of industrial development. Located along 20 Mule Team Road, the properties sits within an established industrial area surrounded by active industrial uses, open desert acreage, and major transportation routes, making them well positioned for future growth and long-term investment. The expansive size allows for privacy, scalability, and phased development. Take advantage of this opportunity to secure industrial acreage in a strategically located desert market. Seller is motivated!
Lot/land
Listing Provided by: Oasis Realty Group
Price cut: $5K (3/17)
$93,000
20 Mule Team Rd, Boron, CA 93516
--beds
--baths
40Acres
Unimproved Land
Built in ----
40 Acres Lot
$-- Zestimate®
$--/sqft
$-- HOA
What's special
- 96 days |
- 57 |
- 2 |
Zillow last checked:
Listing updated:
Listing Provided by:
Courtney Robinson DRE #02241023 760-718-8447,
Oasis Realty Group
Source: CRMLS,MLS#: HD25257255 Originating MLS: California Regional MLS
Facts & features
Property
Features
- Has view: Yes
- View description: Desert, Mountain(s)
Lot
- Size: 40 Acres
- Features: Lot Over 40000 Sqft
Details
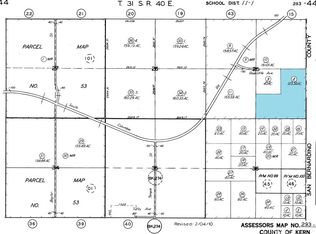
- Additional parcels included: 23129007000
- Parcel number: 23129010008
- Zoning: m-1 pd and m-2
- Special conditions: Standard
Utilities & green energy
- Water: None
- Utilities for property: Water Not Available
Community & HOA
Community
- Features: Rural
Location
- Region: Boron
Financial & listing details
- Tax assessed value: $16,320
- Annual tax amount: $385
- Date on market: 1/8/2026
- Listing terms: Cash
Estimated market value
Not available
Estimated sales range
Not available
$1,775/mo
Price history
Price history
| Date | Event | Price |
|---|---|---|
| 3/17/2026 | Price change | $14,000-26.3% |
Source: | ||
| 3/17/2026 | Price change | $19,000-79.6% |
Source: | ||
| 1/9/2026 | Listed for sale | $93,000+132.5% |
Source: | ||
| 1/24/2024 | Sold | $40,000-18.4% |
Source: | ||
| 11/21/2023 | Pending sale | $49,000 |
Source: | ||
| 8/1/2023 | Price change | $49,000+75% |
Source: | ||
| 1/20/2022 | Pending sale | $28,000 |
Source: | ||
| 12/7/2021 | Listed for sale | $28,000-30% |
Source: | ||
| 10/16/2021 | Contingent | $40,000+37.9% |
Source: | ||
| 10/11/2021 | Price change | $29,000-27.5% |
Source: | ||
| 8/25/2021 | Listed for sale | $40,000-68% |
Source: | ||
| 8/6/2021 | Listing removed | -- |
Source: | ||
| 6/7/2021 | Pending sale | $125,000 |
Source: | ||
| 5/19/2021 | Price change | $125,000-34.2% |
Source: | ||
| 4/9/2021 | Price change | $190,000-61.9% |
Source: | ||
| 1/11/2021 | Price change | $499,000-28.6% |
Source: NAI Capital, Inc. #530697 Report a problem | ||
| 12/17/2020 | Listed for sale | $699,000+4560% |
Source: NAI Capital, Inc. #530697 Report a problem | ||
| 10/28/2020 | Sold | $15,000+476.9% |
Source: Public Record Report a problem | ||
| 6/20/2017 | Sold | $2,600 |
Source: Public Record Report a problem | ||
Public tax history
Public tax history
| Year | Property taxes | Tax assessment |
|---|---|---|
| 2025 | $385 +0.9% | $16,320 +2.5% |
| 2024 | $381 +2.4% | $15,918 +2% |
| 2023 | $372 +3.7% | $15,606 +2% |
| 2022 | $359 +3.2% | $15,300 +2% |
| 2021 | $348 +80.2% | $15,000 +443.7% |
| 2020 | $193 +0.1% | $2,759 +2% |
| 2019 | $193 +457.7% | $2,705 +2% |
| 2018 | $35 -42.2% | $2,652 -42.6% |
| 2017 | $60 | $4,617 +2% |
| 2016 | $60 +8.4% | $4,526 +1.5% |
| 2015 | $55 +1.5% | $4,458 +2% |
| 2014 | $54 | $4,371 +22.9% |
| 2001 | -- | $3,556 +2% |
| 2000 | -- | $3,486 |
Find assessor info on the county website
Monthly payment
Estimated monthly payment
All calculations are estimates and provided by Zillow, Inc. for informational purposes only. Actual amounts may vary.
HOA fees may include property taxes on listings classified as Co-Ops. Contact the listing agent and/or owner for fee details.
Mortgage interest rates are dependent on a number of factors, including credit score, down payment, and repayment length. Interest rate data provided by Zillow Group Marketplace, Inc. as of 1/1/1970 from various mortgage lenders with which we have lead or other similar arrangements; the Estimated Payment is an average of those rates.
See how much you could borrow to make a competitive offer.
Climate risks
Neighborhood: 93516
Nearby schools
GreatSchools rating
- 1/10West Boron Elementary SchoolGrades: K-6Distance: 3.1 mi
- 3/10Boron Junior-Senior High SchoolGrades: 7-12Distance: 0.9 mi
- 5/10Irving L. Branch Elementary SchoolGrades: 3-6Distance: 17.9 mi
A local agent can set up tours, give advice and negotiate with sellers.
A local lender can help you make sure your offer is ready when you are.
- California
- Kern County
- Boron
- 93516
- 20 Mule Team Rd
Nearby cities
Nearby zip codes
Other Boron Topics
