$533,900
5 bd|4 ba|3k sqft
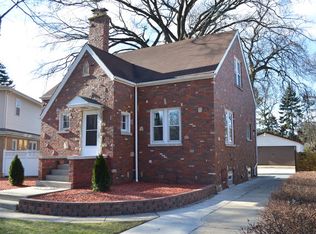
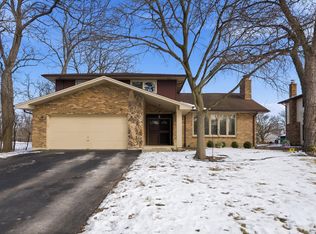
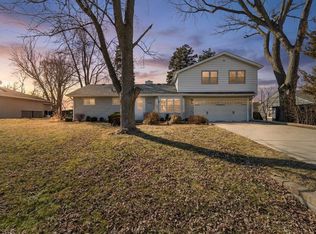
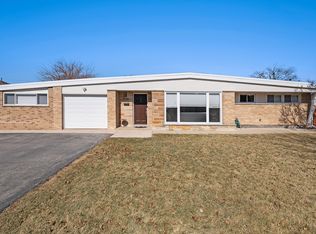
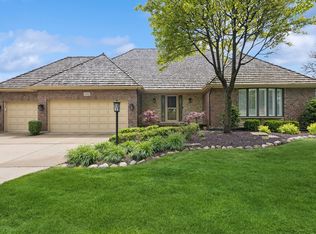
20 Forbes Rd, Riverside, IL 60546
Off Market
Likely to sell faster than
Zillow last checked: 8 hours ago
Listing updated: January 20, 2026 at 10:07am
Ryan O'Connor 630-930-7292,
Baird & Warner
$733,700
$697,000 - $770,000
$4,215/mo
| Date | Event | Price |
|---|---|---|
| 1/20/2026 | Contingent | $725,000$282/sqft |
Source: | ||
| 1/15/2026 | Listed for sale | $725,000+9%$282/sqft |
Source: | ||
| 2/20/2024 | Sold | $665,000-1.5%$258/sqft |
Source: | ||
| 1/11/2024 | Contingent | $675,000$262/sqft |
Source: | ||
| 12/30/2023 | Listed for sale | $675,000$262/sqft |
Source: | ||
| 12/22/2023 | Contingent | $675,000$262/sqft |
Source: | ||
| 12/16/2023 | Listed for sale | $675,000+170%$262/sqft |
Source: | ||
| 10/14/2022 | Sold | $250,000-19.5%$97/sqft |
Source: Agent Provided Report a problem | ||
| 6/19/2019 | Sold | $310,500-8.1%$121/sqft |
Source: | ||
| 4/21/2019 | Pending sale | $338,000$131/sqft |
Source: PALEOS PROPERTIES LLC #10341944 Report a problem | ||
| 4/12/2019 | Listed for sale | $338,000$131/sqft |
Source: PALEOS PROPERTIES LLC #10341944 Report a problem | ||
| 12/27/2018 | Listing removed | $338,000$131/sqft |
Source: Redfin Corporation #10080208 Report a problem | ||
| 10/31/2018 | Pending sale | $338,000$131/sqft |
Source: Redfin Corporation #10080208 Report a problem | ||
| 9/12/2018 | Price change | $338,000-10.5%$131/sqft |
Source: Redfin Corporation #10080208 Report a problem | ||
| 7/31/2018 | Price change | $377,700-2.9%$147/sqft |
Source: Redfin Corporation #09947756 Report a problem | ||
| 6/6/2018 | Price change | $389,000-2.3%$151/sqft |
Source: Redfin Corporation #09947756 Report a problem | ||
| 5/11/2018 | Listed for sale | $398,000$155/sqft |
Source: Redfin Corporation #09947756 Report a problem | ||
| Year | Property taxes | Tax assessment |
|---|---|---|
| 2023 | $6,718 -2.3% | $21,000 +17% |
| 2022 | $6,873 +4.1% | $17,943 |
| 2021 | $6,604 +3.4% | $17,943 |
| 2020 | $6,388 +16.9% | $17,943 +15.6% |
| 2019 | $5,464 -21.6% | $15,525 -23.9% |
| 2018 | $6,971 +76.7% | $20,405 |
| 2017 | $3,945 -18.1% | $20,405 +20.6% |
| 2016 | $4,819 -2.6% | $16,919 -5.7% |
| 2015 | $4,946 +3.9% | $17,942 -2.5% |
| 2014 | $4,760 +5.9% | $18,402 -4.4% |
| 2013 | $4,495 +7.1% | $19,247 |
| 2012 | $4,199 +8.3% | $19,247 |
| 2011 | $3,877 +19.7% | $19,247 -17.3% |
| 2010 | $3,238 +2.9% | $23,286 |
| 2009 | $3,147 +2.1% | $23,286 -12% |
| 2008 | $3,083 -25.1% | $26,462 +12.2% |
| 2007 | $4,117 +28.2% | $23,590 |
| 2006 | $3,211 +8% | $23,590 |
| 2005 | $2,973 -10.7% | $23,590 +37% |
| 2004 | $3,328 +31.9% | $17,222 |
| 2003 | $2,524 -13.1% | $17,222 |
| 2002 | $2,905 +41.4% | $17,222 +50.1% |
| 2001 | $2,054 +2.6% | $11,471 |
| 2000 | $2,003 | $11,471 |
| 1999 | -- | $11,471 |
Find assessor info on the county website
Source: MRED as distributed by MLS GRID. This data may not be complete. We recommend contacting the local school district to confirm school assignments for this home.