$568,900
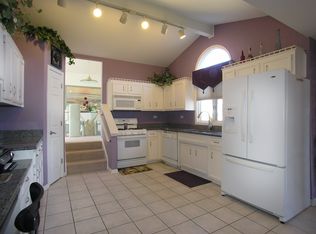
4 bd|2 ba|2.7k sqft
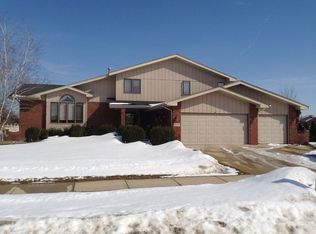
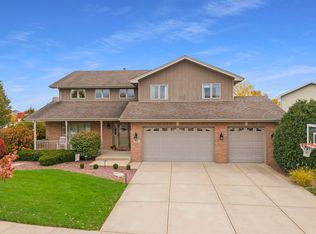
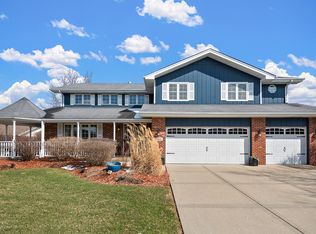
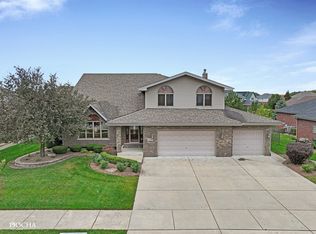
19600 Ridgemont Dr, Tinley Park, IL 60487
Off Market
Zillow last checked: 7 hours ago
Listing updated: March 21, 2026 at 06:41am
Jessica Karczewski 708-214-3763,
Village Realty, Inc.
Not available
Estimated sales range
Not available
Not available
| Date | Event | Price |
|---|---|---|
| 3/17/2026 | Contingent | $589,900$150/sqft |
Source: | ||
| 3/10/2026 | Listed for sale | $589,900$150/sqft |
Source: | ||
| 3/6/2026 | Contingent | $589,900$150/sqft |
Source: | ||
| 2/25/2026 | Listed for sale | $589,900$150/sqft |
Source: | ||
| 11/17/2025 | Listing removed | $589,900$150/sqft |
Source: | ||
| 11/10/2025 | Price change | $589,900-1.7%$150/sqft |
Source: | ||
| 10/6/2025 | Price change | $599,900-2.5%$153/sqft |
Source: | ||
| 9/30/2025 | Price change | $615,000-1.6%$157/sqft |
Source: | ||
| 9/13/2025 | Listed for sale | $625,000+81.2%$159/sqft |
Source: | ||
| 11/28/2017 | Sold | $345,000-1.4%$88/sqft |
Source: | ||
| 10/6/2017 | Pending sale | $349,900$89/sqft |
Source: CENTURY 21 Affiliated #09694632 Report a problem | ||
| 7/19/2017 | Price change | $349,9000%$89/sqft |
Source: CENTURY 21 Affiliated #09694632 Report a problem | ||
| 7/6/2017 | Price change | $349,999-4.1%$89/sqft |
Source: CENTURY 21 Affiliated #09694632 Report a problem | ||
| 5/15/2017 | Price change | $364,900-3.9%$93/sqft |
Source: CENTURY 21 Affiliated #09694632 Report a problem | ||
| 4/5/2017 | Price change | $379,900-2.6%$97/sqft |
Source: CENTURY 21 Affiliated #09694632 Report a problem | ||
| 3/8/2017 | Listed for sale | $389,900$99/sqft |
Source: CENTURY 21 Affiliated #09694632 Report a problem | ||
| Year | Property taxes | Tax assessment |
|---|---|---|
| 2023 | $16,756 +9.3% | $172,592 +9.8% |
| 2022 | $15,332 +10.1% | $157,202 +6.9% |
| 2021 | $13,920 +22.8% | $147,069 +24.5% |
| 2020 | $11,332 +2.7% | $118,162 -19.1% |
| 2019 | $11,037 -17.1% | $146,046 +3% |
| 2018 | $13,316 +0% | $141,847 +2.4% |
| 2017 | $13,313 +1.1% | $138,536 +3.5% |
| 2016 | $13,167 +4.3% | $133,787 +3.7% |
| 2015 | $12,623 | $129,075 +0.7% |
| 2014 | $12,623 +3.5% | $128,178 -1.3% |
| 2013 | $12,193 +0.7% | $129,840 -5% |
| 2012 | $12,107 +5% | $136,673 -5% |
| 2011 | $11,529 +2.6% | $143,866 -3.5% |
| 2010 | $11,240 +3.9% | $149,083 -2.4% |
| 2009 | $10,820 -0.3% | $152,671 -3.4% |
| 2008 | $10,857 | $157,966 +2.5% |
| 2007 | -- | $154,113 +30.4% |
| 2006 | $8,199 +4.8% | $118,178 +8.4% |
| 2005 | $7,822 +8.7% | $109,000 +8% |
| 2004 | $7,199 +5.8% | $100,926 +5.1% |
| 2003 | $6,804 +2.8% | $96,010 +7.6% |
| 2002 | $6,620 +6.3% | $89,200 +1.9% |
| 2001 | $6,230 -30.8% | $87,563 +7% |
| 2000 | $9,007 | $81,835 |
Find assessor info on the county website
Source: MRED as distributed by MLS GRID. This data may not be complete. We recommend contacting the local school district to confirm school assignments for this home.