$832,100
5 bd|4 ba|2.3k sqft
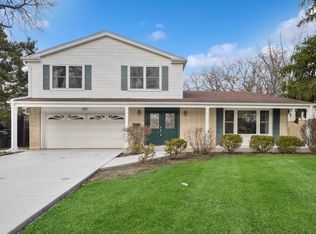
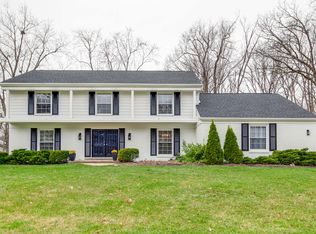
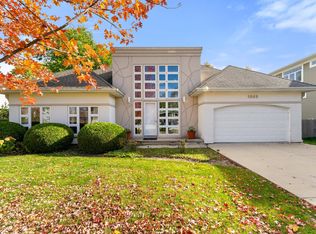
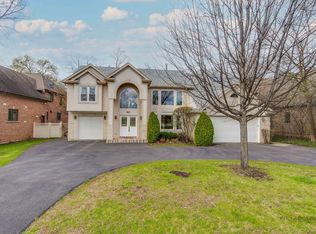
1909 Kiest Ave, Northbrook, IL 60062
Off Market
Zillow last checked: 7 hours ago
Listing updated: April 10, 2026 at 10:06pm
Jamie Walker 847-295-0700,
@properties Christie's International Real Estate,
Adele Curtis,
@properties Christie's International Real Estate
$849,300
$807,000 - $892,000
$4,278/mo
| Date | Event | Price |
|---|---|---|
| 4/6/2026 | Listed for sale | $865,000+59.4%$395/sqft |
Source: | ||
| 8/13/2015 | Sold | $542,500-4.7%$248/sqft |
Source: | ||
| 7/19/2015 | Pending sale | $569,000$260/sqft |
Source: Berkshire Hathaway HomeServices KoenigRubloff Realty Group #08815664 Report a problem | ||
| 6/17/2015 | Price change | $569,000-3.4%$260/sqft |
Source: Berkshire Hathaway HomeServices KoenigRubloff Realty Group #08815664 Report a problem | ||
| 4/9/2015 | Price change | $589,000-1.8%$269/sqft |
Source: Berkshire Hathaway HomeServices KoenigRubloff Realty Group #08815664 Report a problem | ||
| 2/12/2015 | Price change | $599,999-3.2%$274/sqft |
Source: Berkshire Hathaway HomeServices KoenigRubloff Realty Group #08815664 Report a problem | ||
| 1/15/2015 | Listed for sale | $619,900+188.3%$283/sqft |
Source: Berkshire Hathaway HomeServices KoenigRubloff Realty Group #08815664 Report a problem | ||
| 4/26/1996 | Sold | $215,000$98/sqft |
Source: Public Record Report a problem | ||
| Year | Property taxes | Tax assessment |
|---|---|---|
| 2023 | $12,721 +3.3% | $59,000 |
| 2022 | $12,316 -3.4% | $59,000 +8.5% |
| 2021 | $12,749 +1.6% | $54,364 |
| 2020 | $12,550 +3% | $54,364 -9% |
| 2019 | $12,181 +4.2% | $59,741 +12% |
| 2018 | $11,690 +2.5% | $53,354 |
| 2017 | $11,402 +4.5% | $53,354 |
| 2016 | $10,912 +10.7% | $53,354 +20.6% |
| 2015 | $9,859 +4.5% | $44,240 |
| 2014 | $9,431 +3.3% | $44,240 |
| 2013 | $9,126 -2.6% | $44,240 -12.7% |
| 2012 | $9,371 +8% | $50,672 |
| 2011 | $8,676 +5.1% | $50,672 |
| 2010 | $8,252 +5% | $50,672 -2.5% |
| 2009 | $7,859 +13.2% | $51,992 -7% |
| 2008 | $6,942 +7.7% | $55,906 |
| 2007 | $6,446 +67.3% | $55,906 +77.4% |
| 2006 | $3,852 +3.4% | $31,514 |
| 2005 | $3,725 +4.1% | $31,514 |
| 2004 | $3,580 +1% | $31,514 +33.3% |
| 2003 | $3,545 +6.7% | $23,638 +3.9% |
| 2002 | $3,323 +17.3% | $22,746 |
| 2001 | $2,834 +3.2% | $22,746 +20.7% |
| 2000 | $2,746 +2.7% | $18,846 |
| 1999 | $2,673 | $18,846 |
Find assessor info on the county website
Source: MRED as distributed by MLS GRID. This data may not be complete. We recommend contacting the local school district to confirm school assignments for this home.