$166,800
3 bd|2 ba|1.2k sqft
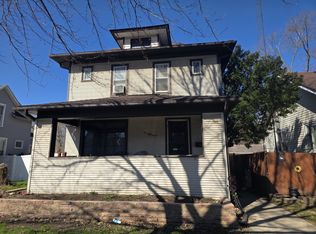
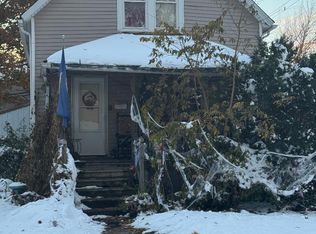
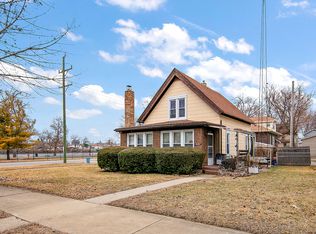
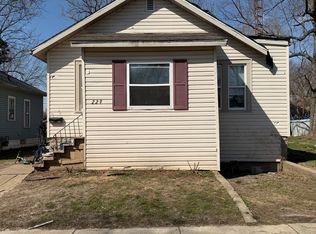
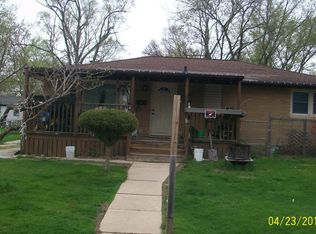
1861 Summit Ave, Kankakee, IL 60901
Off Market
Zillow last checked: 7 hours ago
Listing updated: February 26, 2026 at 08:14am
Dylan Cohen 815-793-3613,
Green Real Estate
Not available
Estimated sales range
Not available
$1,593/mo
| Date | Event | Price |
|---|---|---|
| 2/26/2026 | Contingent | $75,000$77/sqft |
Source: | ||
| 2/20/2026 | Listed for sale | $75,000-6.3%$77/sqft |
Source: | ||
| 11/3/2025 | Listing removed | $80,000$82/sqft |
Source: | ||
| 9/9/2025 | Contingent | $80,000$82/sqft |
Source: | ||
| 6/3/2025 | Price change | $80,000-5.9%$82/sqft |
Source: | ||
| 5/27/2025 | Listed for sale | $85,000+2.4%$87/sqft |
Source: | ||
| 1/3/2023 | Listing removed | -- |
Source: | ||
| 3/10/2022 | Contingent | $82,999$85/sqft |
Source: | ||
| 1/31/2022 | Listed for sale | $82,999+177.6%$85/sqft |
Source: | ||
| 5/25/2012 | Sold | $29,900-24.3%$31/sqft |
Source: | ||
| 1/27/2012 | Listing removed | $39,500$40/sqft |
Source: Coldwell Banker Residential Brokerage - Bradley #07718757 Report a problem | ||
| 8/3/2011 | Price change | $39,500-20.8%$40/sqft |
Source: Coldwell Banker Residential Brokerage - Bradley #07718757 Report a problem | ||
| 7/3/2011 | Price change | $49,900-4%$51/sqft |
Source: Coldwell Banker Residential Brokerage - Bradley #07718757 Report a problem | ||
| 6/12/2011 | Price change | $52,000-5.3%$53/sqft |
Source: Coldwell Banker Residential Brokerage - Bradley #07718757 Report a problem | ||
| 5/6/2011 | Price change | $54,900-8.3%$56/sqft |
Source: Coldwell Banker Residential Brokerage - Bradley #07718757 Report a problem | ||
| 4/9/2011 | Price change | $59,900-20.1%$61/sqft |
Source: Coldwell Banker Residential Brokerage - Bradley #07718757 Report a problem | ||
| 1/29/2011 | Listed for sale | $75,000$77/sqft |
Source: NRT Chicago #07718757 Report a problem | ||
| Year | Property taxes | Tax assessment |
|---|---|---|
| 2024 | $3,716 +3.8% | $31,430 +12.3% |
| 2023 | $3,580 +7.5% | $28,000 +14.2% |
| 2022 | $3,330 +6% | $24,508 +10.5% |
| 2021 | $3,143 +7.8% | $22,179 +11.3% |
| 2020 | $2,916 +4.9% | $19,936 +7.5% |
| 2019 | $2,779 -7.3% | $18,545 +8% |
| 2018 | $2,997 | $17,172 +2.3% |
| 2017 | $2,997 +6.7% | $16,794 +2% |
| 2016 | $2,809 +3.5% | $16,465 -2% |
| 2015 | $2,713 | $16,801 -10% |
| 2014 | $2,713 | $18,667 -4% |
| 2013 | -- | $19,445 -4.5% |
| 2012 | -- | $20,365 -14.7% |
| 2011 | -- | $23,861 -2% |
| 2009 | $1,639 -18% | $24,347 |
| 2008 | $1,999 | $24,347 +36% |
| 2002 | -- | $17,905 +4.3% |
| 2001 | -- | $17,175 |
| 2000 | -- | $17,175 |
Find assessor info on the county website
Source: MRED as distributed by MLS GRID. This data may not be complete. We recommend contacting the local school district to confirm school assignments for this home.