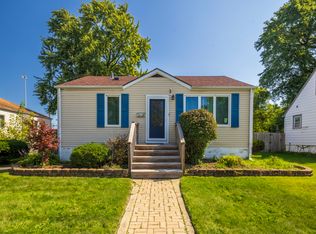
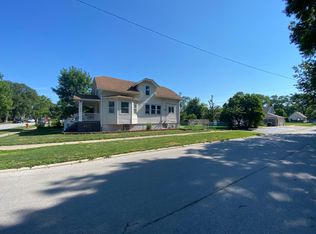
$226,100
4 bd|2 ba|1.4k sqft
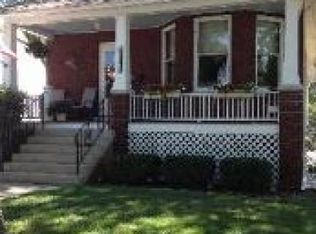
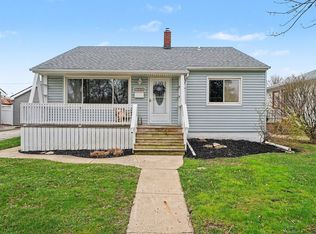
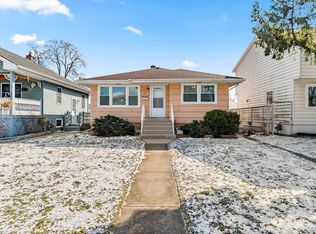
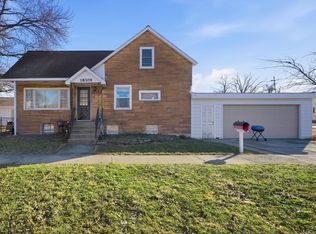
18287 Ada St, Lansing, IL 60438
Off Market
Zillow last checked: 7 hours ago
Listing updated: March 27, 2026 at 01:43am
Jorge Villegas (312)608-8015,
Real Broker LLC
Not available
Estimated sales range
Not available
Not available
| Date | Event | Price |
|---|---|---|
| 3/27/2026 | Contingent | $213,000$234/sqft |
Source: | ||
| 3/17/2026 | Price change | $213,000-2.3%$234/sqft |
Source: | ||
| 3/6/2026 | Listed for sale | $218,000$240/sqft |
Source: | ||
| 3/5/2026 | Listing removed | $218,000$240/sqft |
Source: | ||
| 2/19/2026 | Price change | $218,000-2.2%$240/sqft |
Source: | ||
| 1/30/2026 | Price change | $223,000-3%$245/sqft |
Source: | ||
| 1/13/2026 | Price change | $230,000-1.7%$253/sqft |
Source: | ||
| 1/7/2026 | Listed for sale | $234,000$257/sqft |
Source: | ||
| 1/7/2026 | Listing removed | $234,000$257/sqft |
Source: | ||
| 11/26/2025 | Listed for sale | $234,000+17%$257/sqft |
Source: | ||
| 6/3/2022 | Sold | $200,000+2.6%$220/sqft |
Source: | ||
| 4/30/2022 | Contingent | $195,000$214/sqft |
Source: | ||
| 4/23/2022 | Listed for sale | $195,000$214/sqft |
Source: | ||
| 2/22/2022 | Contingent | $195,000$214/sqft |
Source: | ||
| 2/15/2022 | Listed for sale | $195,000+8.4%$214/sqft |
Source: | ||
| 5/18/2018 | Listing removed | $1,500$2/sqft |
Source: Proven Real Estate Services LLC #09895410 Report a problem | ||
| 3/26/2018 | Listed for rent | $1,500$2/sqft |
Source: Proven Real Estate Services LLC #09895410 Report a problem | ||
| 10/14/2011 | Listing removed | $179,900$198/sqft |
Source: Rosenboom Realty Inc. #07802594 Report a problem | ||
| 5/15/2011 | Listed for sale | $179,900+22.4%$198/sqft |
Source: RE/MAX All Properties #7802594 Report a problem | ||
| 10/12/2005 | Sold | $147,000$162/sqft |
Source: Public Record Report a problem | ||
| Year | Property taxes | Tax assessment |
|---|---|---|
| 2023 | $7,257 +45.2% | $14,999 +35% |
| 2022 | $5,000 +1.6% | $11,113 |
| 2021 | $4,920 +4.7% | $11,113 |
| 2020 | $4,700 +30.5% | $11,113 +13.9% |
| 2019 | $3,601 +2% | $9,755 |
| 2018 | $3,531 -1.9% | $9,755 |
| 2017 | $3,600 -11.1% | $9,755 -1.5% |
| 2016 | $4,051 +9.5% | $9,906 |
| 2015 | $3,700 +0.6% | $9,906 |
| 2014 | $3,676 -1.9% | $9,906 -9.6% |
| 2013 | $3,748 +5.9% | $10,953 |
| 2012 | $3,540 +1.3% | $10,953 |
| 2011 | $3,495 -13.2% | $10,953 -16.1% |
| 2010 | $4,025 -17.3% | $13,060 |
| 2009 | $4,869 +50.4% | $13,060 -5% |
| 2008 | $3,238 +1.7% | $13,749 +17.1% |
| 2007 | $3,184 -10.9% | $11,741 |
| 2006 | $3,573 +51% | $11,741 |
| 2005 | $2,365 +1.2% | $11,741 +8% |
| 2004 | $2,337 +4.4% | $10,871 |
| 2003 | $2,239 +17.8% | $10,871 |
| 2002 | $1,900 -2.3% | $10,871 +5.7% |
| 2001 | $1,944 +1% | $10,282 |
| 2000 | $1,925 +11.4% | $10,282 |
| 1999 | $1,727 | $10,282 |
Find assessor info on the county website
Source: MRED as distributed by MLS GRID. This data may not be complete. We recommend contacting the local school district to confirm school assignments for this home.