$1,950
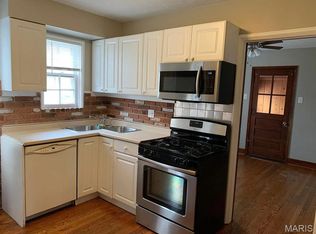
4 bd|1 ba|-- sqft
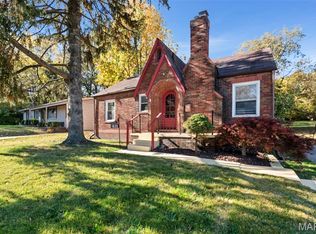
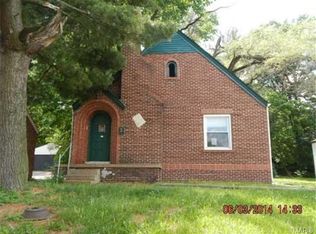
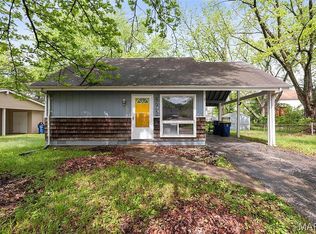
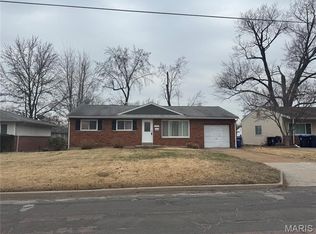
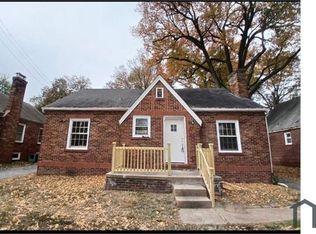
1811 S New Florissant Rd, Florissant, MO 63031
For Rent
Zillow last checked: 7 hours ago
Listing updated: March 21, 2026 at 06:36pm
Rosalind D McFadden 314-933-4003,
Next Phase Realty LLC
Not available
Estimated sales range
Not available
Not available
| Date | Event | Price |
|---|---|---|
| 3/22/2026 | Pending sale | $162,500$145/sqft |
Source: | ||
| 3/20/2026 | Listed for rent | $1,700+6.3%$2/sqft |
Source: Zillow Rentals Report a problem | ||
| 3/20/2026 | Listing removed | $1,600$1/sqft |
Source: Zillow Rentals Report a problem | ||
| 3/17/2026 | Listed for sale | $162,500+105.7%$145/sqft |
Source: | ||
| 2/19/2026 | Listed for rent | $1,600$1/sqft |
Source: Zillow Rentals Report a problem | ||
| 2/18/2026 | Listing removed | $1,600$1/sqft |
Source: Zillow Rentals Report a problem | ||
| 1/22/2026 | Listed for rent | $1,600$1/sqft |
Source: Zillow Rentals Report a problem | ||
| 1/21/2026 | Listing removed | $1,600$1/sqft |
Source: Zillow Rentals Report a problem | ||
| 1/5/2026 | Listed for rent | $1,600-13.5%$1/sqft |
Source: Zillow Rentals Report a problem | ||
| 1/4/2026 | Listing removed | $1,850$2/sqft |
Source: Zillow Rentals Report a problem | ||
| 12/2/2025 | Listed for rent | $1,850$2/sqft |
Source: Zillow Rentals Report a problem | ||
| 10/30/2025 | Sold | -- |
Source: | ||
| 9/15/2025 | Pending sale | $79,000$70/sqft |
Source: | ||
| 8/28/2025 | Listed for sale | $79,000-28.2%$70/sqft |
Source: | ||
| 7/1/2025 | Listing removed | $110,000$98/sqft |
Source: | ||
| 4/14/2025 | Price change | $110,000-8.3%$98/sqft |
Source: | ||
| 1/17/2025 | Listed for sale | $120,000$107/sqft |
Source: | ||
| 9/18/2017 | Sold | -- |
Source: Public Record Report a problem | ||
| Year | Property taxes | Tax assessment |
|---|---|---|
| 2025 | -- | $18,660 +13.4% |
| 2024 | $1,296 +0.3% | $16,450 |
| 2023 | $1,291 +17.8% | $16,450 +34.8% |
| 2022 | $1,096 +1.7% | $12,200 |
| 2021 | $1,078 +30.8% | $12,200 +38.8% |
| 2020 | $824 -12.9% | $8,790 |
| 2019 | $946 | $8,790 -4.9% |
| 2018 | $946 | $9,240 |
| 2017 | $946 +0.5% | $9,240 +26.2% |
| 2016 | $941 +22.2% | $7,320 |
| 2015 | $770 | $7,320 -37.9% |
| 2014 | $770 -35.4% | $11,780 |
| 2013 | $1,191 | $11,780 +0.9% |
| 2012 | -- | $11,670 |
| 2011 | -- | $11,670 -11.7% |
| 2010 | $1,119 +6.2% | $13,210 |
| 2009 | $1,054 -2.3% | $13,210 -5.9% |
| 2008 | $1,079 +23.6% | $14,040 |
| 2007 | $873 | $14,040 +36.3% |
| 2006 | $873 -0.3% | $10,300 |
| 2005 | $876 +2.8% | $10,300 +5% |
| 2003 | $852 +2.6% | $9,810 +2% |
| 2002 | $831 +10.1% | $9,620 |
| 2001 | $754 | $9,620 |
Find assessor info on the county website
Source: MARIS. This data may not be complete. We recommend contacting the local school district to confirm school assignments for this home.