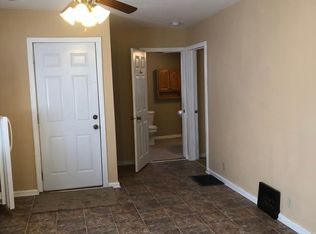
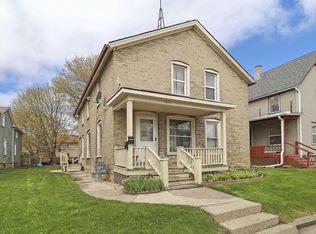
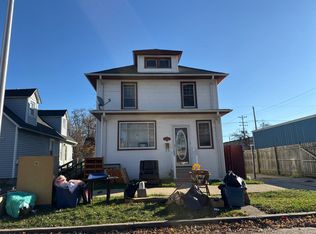
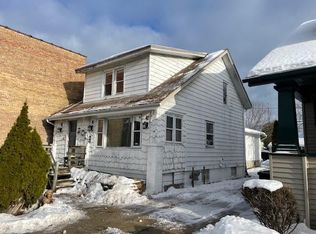
This 2888 square foot single family home has 4 bedrooms and 2.0 bathrooms. This home is located at 1814 Center St, Racine, WI 53403.
Pre-foreclosure
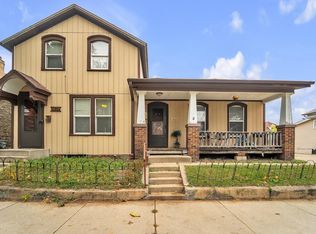
Street View
Est. $160,700
1814 Center St, Racine, WI 53403
4beds
2baths
2,888sqft
SingleFamily
Built in 1893
4,399 Square Feet Lot
$160,700 Zestimate®
$56/sqft
$-- HOA
Overview
- 48 days |
- 15 |
- 1 |
Facts & features
Interior
Bedrooms & bathrooms
- Bedrooms: 4
- Bathrooms: 2
Interior area
- Total interior livable area: 2,888 sqft
Property
Lot
- Size: 4,399 Square Feet
Details
- Parcel number: 276000017597000
Construction
Type & style
- Home type: SingleFamily
Condition
- Year built: 1893
Community & HOA
Location
- Region: Racine
Financial & listing details
- Price per square foot: $56/sqft
- Tax assessed value: $120,100
- Annual tax amount: $3,035
Visit our professional directory to find a foreclosure specialist in your area that can help with your home search.
Find a foreclosure agentForeclosure details
Estimated market value
$160,700
$129,000 - $191,000
$2,490/mo
Price history
Price history
| Date | Event | Price |
|---|---|---|
| 9/8/2005 | Sold | $95,000+26.8%$33/sqft |
Source: Public Record Report a problem | ||
| 7/19/2004 | Sold | $74,900+149.7%$26/sqft |
Source: Agent Provided Report a problem | ||
| 12/18/2003 | Sold | $30,000$10/sqft |
Source: Agent Provided Report a problem | ||
Public tax history
Public tax history
| Year | Property taxes | Tax assessment |
|---|---|---|
| 2024 | $3,035 -14.2% | $120,100 +9.2% |
| 2023 | $3,538 +33.9% | $110,000 +10% |
| 2022 | $2,642 -2.3% | $100,000 +9.9% |
| 2021 | $2,704 +1.7% | $91,000 |
| 2020 | $2,659 +9.7% | $91,000 +8.3% |
| 2019 | $2,423 -0.8% | $84,000 +5% |
| 2018 | $2,443 -3.3% | $80,000 |
| 2017 | $2,525 +7.2% | $80,000 |
| 2016 | $2,357 | $80,000 |
| 2015 | $2,357 | $80,000 |
| 2014 | $2,357 | $80,000 |
| 2013 | $2,357 -3.5% | $80,000 -5.9% |
| 2012 | $2,442 +5.9% | $85,000 -5.6% |
| 2011 | $2,307 +6.6% | $90,000 |
| 2010 | $2,164 +0.1% | $90,000 -4.3% |
| 2009 | $2,161 +0.9% | $94,000 |
| 2008 | $2,141 +5.4% | $94,000 +2.2% |
| 2007 | $2,032 +16.7% | $92,000 +16.5% |
| 2006 | $1,741 +18.8% | $79,000 +23.4% |
| 2005 | $1,466 +15.1% | $64,000 +20.8% |
| 2004 | $1,274 +7.8% | $53,000 +6% |
| 2003 | $1,182 -12.8% | $50,000 +2% |
| 2002 | $1,355 -36.9% | $49,000 +4.3% |
| 2001 | $2,148 +29.6% | $47,000 +4.4% |
| 2000 | $1,657 | $45,000 |
Find assessor info on the county website
BuyAbility℠ payment
Estimated monthly payment
Boost your down payment with 6% savings match
Earn up to a 6% match & get a competitive APY with a *. Zillow has partnered with to help get you home faster.
Learn more*Terms apply. Match provided by Foyer. Account offered by Pacific West Bank, Member FDIC.Climate risks
Neighborhood: Live Towerview
Nearby schools
GreatSchools rating
- 2/10Jones Elementary SchoolGrades: PK-5Distance: 2.3 mi
- NARacine Civil Leaders AcademyemyGrades: PK-7Distance: 0.6 mi
- 3/10Case High SchoolGrades: 9-12Distance: 4.2 mi