This 3156 square foot single family home has 4 bedrooms and 2.0 bathrooms. This home is located at 1806 E 9800 S, Sandy, UT 84092.
Pre-foreclosure
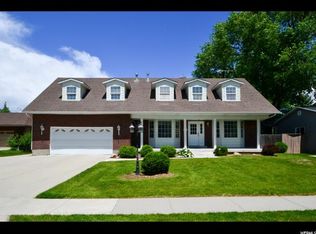
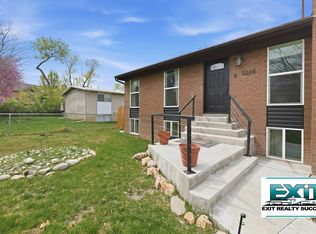
Street View
Est. $626,400
1806 E 9800 S, Sandy, UT 84092
4beds
3,156sqft
SingleFamily
Built in 1983
8,712 Square Feet Lot
$626,400 Zestimate®
$198/sqft
$-- HOA
Overview
- 167 days |
- 31 |
- 1 |
Facts & features
Interior
Bedrooms & bathrooms
- Bedrooms: 4
- Bathrooms: 2
- Full bathrooms: 1
- 3/4 bathrooms: 1
Heating
- Radiant, Gas
Cooling
- None
Appliances
- Included: Dishwasher
Features
- Basement: Finished
- Has fireplace: Yes
Interior area
- Total interior livable area: 3,156 sqft
Property
Parking
- Total spaces: 2
- Parking features: Garage - Attached
Features
- Exterior features: Other
Lot
- Size: 8,712 Square Feet
Details
- Parcel number: 28094050040000
- Zoning: Single-Family
Construction
Type & style
- Home type: SingleFamily
Materials
- Other
- Roof: Asphalt
Condition
- Year built: 1983
Utilities & green energy
- Utilities for property: Power: Connected, Water: Connected, Gas: Connected, Sewer: Connected
Community & HOA
Location
- Region: Sandy
Financial & listing details
- Price per square foot: $198/sqft
- Tax assessed value: $553,200
- Annual tax amount: $2,845
- Inclusions: Range, Ceiling Fan, Fireplace Insert, Storage Sheds
Visit our professional directory to find a foreclosure specialist in your area that can help with your home search.
Find a foreclosure agentForeclosure details
Estimated market value
$626,400
$595,000 - $664,000
$3,129/mo
Price history
Price history
| Date | Event | Price |
|---|---|---|
| 6/2/2025 | Listing removed | $710,000$225/sqft |
Source: | ||
| 4/18/2025 | Price change | $710,000-2.1%$225/sqft |
Source: | ||
| 3/31/2025 | Listed for sale | $725,000$230/sqft |
Source: | ||
| 3/29/2025 | Pending sale | $725,000$230/sqft |
Source: | ||
| 11/27/2024 | Listed for sale | $725,000+81.3%$230/sqft |
Source: | ||
| 5/13/2020 | Listing removed | $399,999$127/sqft |
Source: Coldwell Banker Residential Brokerage - The Salt Lake-Avenues Office #1663788 Report a problem | ||
| 4/21/2020 | Pending sale | $399,999$127/sqft |
Source: Coldwell Banker Residential Brokerage - The Salt Lake-Avenues Office #1663788 Report a problem | ||
| 3/26/2020 | Listed for sale | $399,999+17.7%$127/sqft |
Source: Coldwell Banker Residential Brokerage-Salt Lake #1663788 Report a problem | ||
| 9/29/2016 | Sold | -- |
Source: Agent Provided Report a problem | ||
| 8/27/2016 | Price change | $339,900-2.9%$108/sqft |
Source: Visual Tour #1402679 Report a problem | ||
| 7/10/2016 | Price change | $349,900-2.8%$111/sqft |
Source: Visual Tour #1402679 Report a problem | ||
| 6/9/2016 | Listed for sale | $359,900$114/sqft |
Source: Visual Tour #1402679 Report a problem | ||
Public tax history
Public tax history
| Year | Property taxes | Tax assessment |
|---|---|---|
| 2024 | $2,845 +7.6% | $304,260 +9.3% |
| 2023 | $2,644 -2.3% | $278,245 -0.7% |
| 2022 | $2,705 +13.9% | $280,115 +33.6% |
| 2021 | $2,375 +8% | $209,660 +14.3% |
| 2020 | $2,200 +1% | $183,370 +3.5% |
| 2019 | $2,178 +6.7% | $177,210 +6.3% |
| 2018 | $2,042 +4.5% | $166,705 -35% |
| 2017 | $1,955 +13.1% | $256,600 +8.5% |
| 2016 | $1,729 -2.4% | $236,500 +0.3% |
| 2015 | $1,771 | $235,900 +8.5% |
| 2014 | $1,771 | $217,500 +3.6% |
| 2013 | -- | $209,900 +2.9% |
| 2012 | -- | $204,000 -3.4% |
| 2011 | -- | $211,100 -11.3% |
| 2010 | -- | $238,000 -1% |
| 2009 | -- | $240,500 -13.5% |
| 2008 | $1,598 | $278,000 -0.1% |
| 2007 | -- | $278,300 +31.1% |
| 2006 | -- | $212,300 +11.1% |
| 2005 | -- | $191,100 +6.3% |
| 2002 | -- | $179,700 +8.3% |
| 2001 | -- | $165,900 -6% |
| 2000 | -- | $176,400 |
Find assessor info on the county website
Monthly payment
Estimated monthly payment
All calculations are estimates and provided by Zillow, Inc. for informational purposes only. Actual amounts may vary.
HOA fees may include property taxes on listings classified as Co-Ops. Contact the listing agent and/or owner for fee details.
Mortgage interest rates are dependent on a number of factors, including credit score, down payment, and repayment length. Interest rate data provided by Zillow Group Marketplace, Inc. as of 1/1/1970 from various mortgage lenders with which we have lead or other similar arrangements; the Estimated Payment is an average of those rates.
See how much you could borrow to make a competitive offer.
Climate risks
Neighborhood: 84092
Nearby schools
GreatSchools rating
- 10/10Willow Canyon Elementary SchoolGrades: K-5Distance: 0.4 mi
- 6/10Eastmont Middle SchoolGrades: 6-8Distance: 0.9 mi
- 3/10Jordan High SchoolGrades: 8-12Distance: 2.5 mi
Schools provided by the listing agent
- Elementary: Willow Canyon
- Middle: Eastmont
- High: Jordan
- District: Canyons
Source: The MLS. This data may not be complete. We recommend contacting the local school district to confirm school assignments for this home.

- Utah
- Salt Lake County
- Sandy
- 84092
- 1806 E 9800 S
Nearby cities
Nearby zip codes
Other Sandy Topics
