$159,000
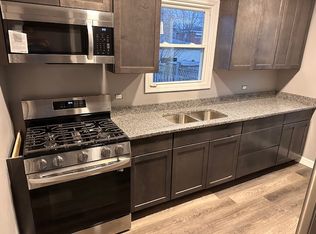
3 bd|1 ba|1.1k sqft
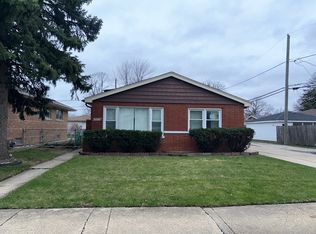
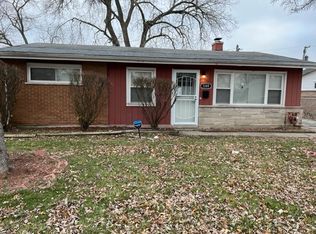
17817 Roy St, Lansing, IL 60438
Off Market
Zillow last checked: 7 hours ago
Listing updated: April 01, 2026 at 06:09pm
Michelle Ward 708-903-0445,
Coldwell Banker Real Estate Group,
John Ward 708-738-6918,
Coldwell Banker Real Estate Group
Not available
Estimated sales range
Not available
Not available
| Date | Event | Price |
|---|---|---|
| 4/2/2026 | Listed for sale | $125,000$105/sqft |
Source: | ||
| 3/26/2026 | Pending sale | $125,000$105/sqft |
Source: | ||
| 3/17/2026 | Price change | $125,000-7.4%$105/sqft |
Source: | ||
| 3/10/2026 | Listed for sale | $135,000+39.9%$114/sqft |
Source: | ||
| 2/25/2019 | Listing removed | $1,475$1/sqft |
Source: Zillow Rental Manager Report a problem | ||
| 2/7/2019 | Price change | $1,475-1.7%$1/sqft |
Source: Zillow Rental Manager Report a problem | ||
| 1/23/2019 | Price change | $1,500-1.6%$1/sqft |
Source: Zillow Rental Manager Report a problem | ||
| 12/31/2018 | Listed for rent | $1,525$1/sqft |
Source: Zillow Rental Manager Report a problem | ||
| 10/25/2018 | Sold | $96,500+175.7%$81/sqft |
Source: Public Record Report a problem | ||
| 3/21/2012 | Sold | $35,000+0.3%$29/sqft |
Source: | ||
| 2/2/2012 | Listed for sale | $34,900$29/sqft |
Source: S. R. Blockson & Associates Realty & Mgmt #07941481 Report a problem | ||
| 12/20/2011 | Listing removed | $34,900$29/sqft |
Source: S. R. Blockson & Associates Realty & Mgmt #07941481 Report a problem | ||
| 12/10/2011 | Listed for sale | $34,900-65.4%$29/sqft |
Source: S. R. Blockson & Associates Realty & Mgmt #07941481 Report a problem | ||
| 11/18/2011 | Sold | $101,000+152.5%$85/sqft |
Source: Agent Provided Report a problem | ||
| 11/9/2011 | Listed for sale | $40,000-60.4%$34/sqft |
Source: foreclosure.com Report a problem | ||
| 9/30/1998 | Sold | $101,000$85/sqft |
Source: Public Record Report a problem | ||
| Year | Property taxes | Tax assessment |
|---|---|---|
| 2023 | $5,363 -11% | $11,085 +19.6% |
| 2022 | $6,025 +2.8% | $9,271 |
| 2021 | $5,861 +7.8% | $9,271 |
| 2020 | $5,439 -5% | $9,271 -7.8% |
| 2019 | $5,727 +1.9% | $10,060 |
| 2018 | $5,621 -1% | $10,060 |
| 2017 | $5,676 +112.9% | $10,060 +36.4% |
| 2016 | $2,667 +10.5% | $7,374 |
| 2015 | $2,414 +0.3% | $7,374 |
| 2014 | $2,408 -13.3% | $7,374 -16.2% |
| 2013 | $2,778 +5.3% | $8,799 |
| 2012 | $2,639 -15.9% | $8,799 -12.4% |
| 2011 | $3,138 -13.5% | $10,039 -21.4% |
| 2010 | $3,627 +11.9% | $12,770 |
| 2009 | $3,240 +10.2% | $12,770 -5% |
| 2008 | $2,940 +1.7% | $13,443 +12.4% |
| 2007 | $2,891 +7.6% | $11,958 |
| 2006 | $2,687 +9.9% | $11,958 |
| 2005 | $2,445 +0.2% | $11,958 +19% |
| 2004 | $2,440 +6.4% | $10,048 |
| 2003 | $2,292 +17.9% | $10,048 |
| 2002 | $1,945 +9.4% | $10,048 +5% |
| 2001 | $1,778 +1% | $9,574 |
| 2000 | $1,760 +4.3% | $9,574 |
| 1999 | $1,688 | $9,574 |
Find assessor info on the county website
Source: MRED as distributed by MLS GRID. This data may not be complete. We recommend contacting the local school district to confirm school assignments for this home.