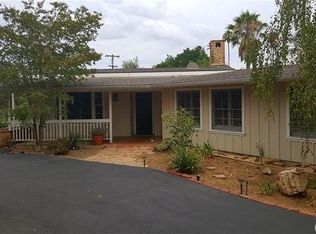
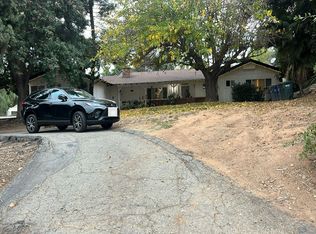
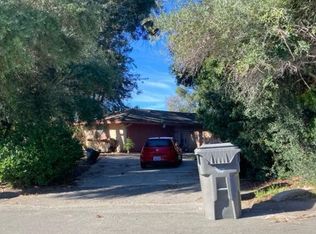
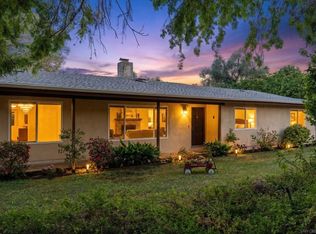
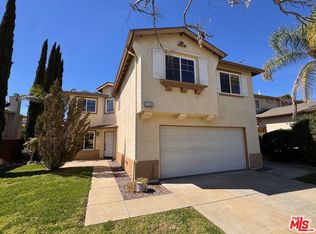
Your Own Slice of Heaven will be found in this Beautifully Maintained Fallbrook Home. Situated on 1 Full Acre it offers Privacy and Stunning Views of the Surrounding Rolling Hills and Peaceful Calmin Knolls Neighborhood. The Master Bedroom and Two Full Baths are on the First Level and are joined by Two Additional Bedrooms, Full Bath and an Office or Media Center on the Second Level. This Open Floorplan offers a Huge Great Room which adjoins a Dining Area, Large Kitchen with Peninsula Island that Showcases the Spacious Kitchen Featuring a Walk In Panty and storage for all of your cooking and entertaining needs. Youll also enjoy many Summer and Winter Evenings relaxing in the Back Yard Oasis Featuring a huge Custom Built Timber Frame Outdoor Patio Cover with Outdoor Kitchen and Firepit. In addition, there is a small Private Orchard with a nice variety of Family Fruit and Citrus trees. Wrap it all up with a Three Car Garage including a Workshop and a nicely accessible driveway Featuring RV Parking. Many Updates have been completed by the Original Owners and Pride of Ownership is evident throughout. This is the first time this Cherished Home has come market so be sure to put it at the Top of your list and Come See why Fallbrook is known as "The Friendly Village".
Foreclosed
Est. $1,040,400
1731 Fuerte St, Fallbrook, CA 92028
3beds
2,346sqft
SingleFamily
Built in 1987
1 Acres Lot
$-- Zestimate®
$443/sqft
$-- HOA
Overview
- 129 days |
- 33 |
- 2 |
Facts & features
Interior
Bedrooms & bathrooms
- Bedrooms: 3
- Bathrooms: 3
- Full bathrooms: 3
Interior area
- Total interior livable area: 2,346 sqft
Property
Parking
- Total spaces: 3
Lot
- Size: 1 Acres
Details
- Parcel number: 1061013000
Construction
Type & style
- Home type: SingleFamily
Condition
- Year built: 1987
Community & HOA
Location
- Region: Fallbrook
Financial & listing details
- Price per square foot: $443/sqft
- Tax assessed value: $1,040,400
- Annual tax amount: $11,194
Visit our professional directory to find a foreclosure specialist in your area that can help with your home search.
Find a foreclosure agentForeclosure details
Estimated market value
Not available
Estimated sales range
Not available
$4,022/mo
Price history
Price history
| Date | Event | Price |
|---|---|---|
| 11/18/2025 | Sold | $1,134,300-7.4%$484/sqft |
Source: Public Record Report a problem | ||
| 7/25/2025 | Listing removed | $1,225,000$522/sqft |
Source: | ||
| 5/30/2025 | Price change | $1,225,000-1.1%$522/sqft |
Source: | ||
| 5/10/2025 | Price change | $1,239,000-0.8%$528/sqft |
Source: | ||
| 5/3/2025 | Price change | $1,249,000+4.2%$532/sqft |
Source: | ||
| 3/6/2025 | Listed for sale | $1,199,000+19.9%$511/sqft |
Source: | ||
| 7/20/2022 | Sold | $1,000,000+4.2%$426/sqft |
Source: Public Record Report a problem | ||
| 5/25/2022 | Pending sale | $960,000$409/sqft |
Source: | ||
| 4/27/2022 | Listed for sale | $960,000$409/sqft |
Source: | ||
Public tax history
Public tax history
| Year | Property taxes | Tax assessment |
|---|---|---|
| 2025 | $11,194 +2.4% | $1,040,400 +2% |
| 2024 | $10,929 +9.7% | $1,020,000 +8.5% |
| 2023 | $9,964 +184.1% | $940,000 +185.7% |
| 2022 | $3,507 +3.5% | $328,988 +2% |
| 2021 | $3,388 -0.7% | $322,538 +1% |
| 2020 | $3,413 +3.2% | $319,232 +2% |
| 2019 | $3,307 +0.5% | $312,973 +2% |
| 2018 | $3,293 +2.1% | $306,837 +2% |
| 2017 | $3,226 +2.6% | $300,822 +2% |
| 2016 | $3,144 +1.6% | $294,924 +1.5% |
| 2015 | $3,093 +2% | $290,495 +2% |
| 2014 | $3,034 | $284,805 +0.5% |
| 2013 | -- | $283,519 +2% |
| 2012 | -- | $277,960 +2% |
| 2011 | -- | $272,511 +0.8% |
| 2010 | -- | $270,475 -0.2% |
| 2009 | -- | $271,118 +2% |
| 2008 | -- | $265,803 +2% |
| 2007 | -- | $260,592 +6.9% |
| 2006 | -- | $243,806 +6.6% |
| 2005 | -- | $228,732 +4% |
| 2004 | -- | $219,836 +1.9% |
| 2003 | -- | $215,808 +2% |
| 2002 | -- | $211,577 +2% |
| 2001 | -- | $207,429 |
Find assessor info on the county website
BuyAbility℠ payment
Estimated monthly payment
All calculations are estimates and provided by Zillow, Inc. for informational purposes only. Actual amounts may vary.
HOA fees may include property taxes on listings classified as Co-Ops. Contact the listing agent and/or owner for fee details.
Mortgage interest rates are dependent on a number of factors, including credit score, down payment, and repayment length. Interest rate data provided by Zillow Group Marketplace, Inc. as of 1/1/1970 from various mortgage lenders with which we have lead or other similar arrangements; the Estimated Payment is an average of those rates.
See how much you could borrow to make a competitive offer.
Boost your down payment with 6% savings match
Earn up to a 6% match & get a competitive APY with a *. Zillow has partnered with to help get you home faster.
Learn more*Terms apply. Match provided by Foyer. Account offered by Pacific West Bank, Member FDIC.Climate risks
Neighborhood: 92028
Nearby schools
GreatSchools rating
- 8/10Live Oak Elementary SchoolGrades: K-6Distance: 0.6 mi
- 4/10James E. Potter Intermediate SchoolGrades: 7-8Distance: 0.4 mi
- 6/10Fallbrook High SchoolGrades: 9-12Distance: 1.6 mi
- California
- San Diego County
- Fallbrook
- 92028
- 1731 Fuerte St
Nearby cities
Nearby zip codes
Other Fallbrook Topics
