$553,300
-- bd|-- ba|-- sqft
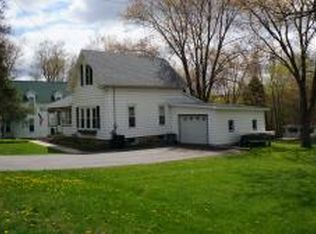
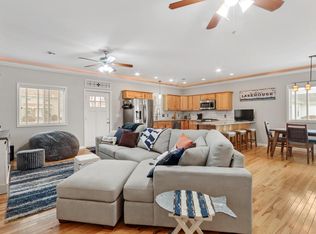
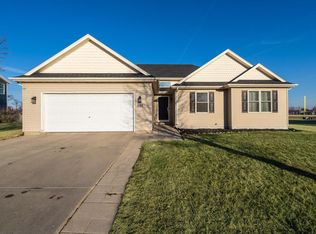
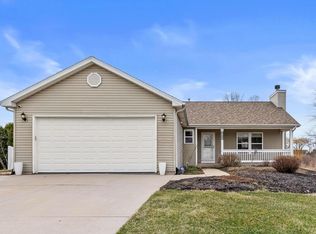
179 W Main St, Fontana, WI 53125
Off Market
Zillow last checked: 7 hours ago
Listing updated: March 31, 2026 at 08:36pm
Jose Rey 815-861-2757,
Compass
Not available
Estimated sales range
Not available
Not available
| Date | Event | Price |
|---|---|---|
| 4/1/2026 | Contingent | $429,000$318/sqft |
Source: | ||
| 3/16/2026 | Listed for sale | $429,000+329%$318/sqft |
Source: | ||
| 4/17/2014 | Sold | $100,000-4.8%$74/sqft |
Source: Public Record Report a problem | ||
| 3/16/2014 | Price change | $105,000-4.5%$78/sqft |
Source: Keefe Real Estate #1308467 Report a problem | ||
| 10/17/2013 | Price change | $110,000-13%$81/sqft |
Source: Keefe Real Estate #1308467 Report a problem | ||
| 9/11/2013 | Price change | $126,500-3.8%$94/sqft |
Source: Keefe Real Estate #1308467 Report a problem | ||
| 8/9/2013 | Price change | $131,500-5.4%$97/sqft |
Source: Keefe Real Estate #1308467 Report a problem | ||
| 7/11/2013 | Price change | $139,000-4.1%$103/sqft |
Source: Keefe Real Estate #1308467 Report a problem | ||
| 6/5/2013 | Price change | $144,900-6.5%$107/sqft |
Source: Keefe Real Estate #1308467 Report a problem | ||
| 5/9/2013 | Listed for sale | $154,900+3.3%$115/sqft |
Source: Keefe Real Estate #1308467 Report a problem | ||
| 9/15/2012 | Listing removed | $149,900$111/sqft |
Source: The Rauland Agency, Inc. #1237067 Report a problem | ||
| 6/19/2012 | Price change | $149,900-3.2%$111/sqft |
Source: The Rauland Agency, Inc. #1237067 Report a problem | ||
| 3/24/2012 | Price change | $154,900-6.1%$115/sqft |
Source: The Rauland Agency, Inc. #1237067 Report a problem | ||
| 1/18/2012 | Price change | $164,900-5.7%$122/sqft |
Source: The Rauland Agency, Inc. #1237067 Report a problem | ||
| 9/20/2011 | Price change | $174,900-3.9%$130/sqft |
Source: Keefe Real Estate #1211492 Report a problem | ||
| 7/9/2011 | Listed for sale | $182,000$135/sqft |
Source: Keefe Real Estate #1211492 Report a problem | ||
| Year | Property taxes | Tax assessment |
|---|---|---|
| 2024 | $2,298 -6.8% | $304,200 +53.9% |
| 2023 | $2,464 -2.9% | $197,600 |
| 2022 | $2,538 +10.8% | $197,600 |
| 2021 | $2,290 +5.5% | $197,600 +18.8% |
| 2020 | $2,172 +1.9% | $166,400 |
| 2019 | $2,132 +0.2% | $166,400 |
| 2018 | $2,129 +0.5% | $166,400 |
| 2017 | $2,117 -5.8% | $166,400 |
| 2016 | $2,247 +0.4% | $166,400 |
| 2015 | $2,238 -3.4% | $166,400 -0.8% |
| 2014 | $2,316 | $167,700 -7.6% |
| 2013 | $2,316 | $181,400 |
| 2012 | -- | -- |
| 2011 | -- | -- |
| 2010 | -- | -- |
| 2009 | -- | -- |
| 2008 | -- | -- |
| 2007 | -- | -- |
| 2005 | -- | -- |
| 2004 | -- | -- |
| 2003 | -- | -- |
| 2002 | -- | -- |
| 2001 | -- | -- |
| 2000 | -- | -- |
Find assessor info on the county website
Source: MRED as distributed by MLS GRID. This data may not be complete. We recommend contacting the local school district to confirm school assignments for this home.