$319,900
3 bd|3 ba|2.3k sqft
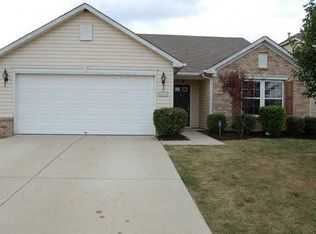
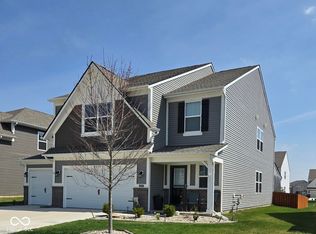
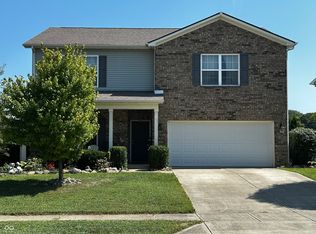
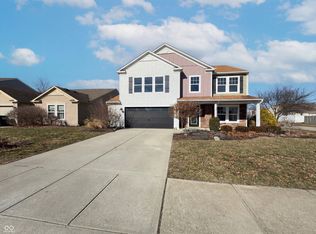
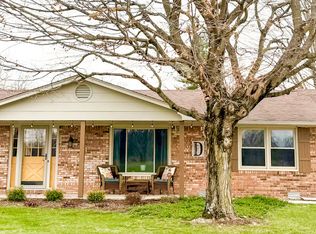
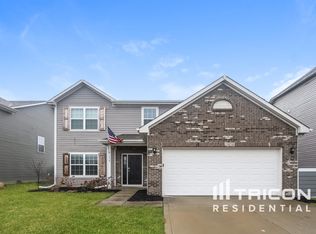
1618 Huntzinger Blvd, Pendleton, IN 46064
Off Market
Likely to sell faster than
Zillow last checked: 7 hours ago
Listing updated: March 26, 2026 at 05:37pm
Ryan Hakes 317-410-0505,
Grace & Agape Real Estate Services
Not available
Estimated sales range
Not available
Not available
| Date | Event | Price |
|---|---|---|
| 3/21/2026 | Listed for sale | $375,000$135/sqft |
Source: | ||
| 3/18/2026 | Listing removed | -- |
Source: Owner Report a problem | ||
| 3/11/2026 | Listed for sale | $375,000+10.3%$135/sqft |
Source: Owner Report a problem | ||
| 8/31/2023 | Sold | $340,000$122/sqft |
Source: | ||
| 8/7/2023 | Pending sale | $340,000$122/sqft |
Source: | ||
| 8/1/2023 | Price change | $340,000-1.6%$122/sqft |
Source: | ||
| 7/26/2023 | Listed for sale | $345,500$124/sqft |
Source: | ||
| 7/26/2023 | Pending sale | $345,500$124/sqft |
Source: | ||
| 6/26/2023 | Price change | $345,500-1.1%$124/sqft |
Source: | ||
| 6/13/2023 | Price change | $349,500-0.1%$126/sqft |
Source: | ||
| 5/8/2023 | Price change | $350,000-2.8%$126/sqft |
Source: | ||
| 4/26/2023 | Listed for sale | $360,000+5.9%$129/sqft |
Source: | ||
| 3/15/2022 | Listing removed | -- |
Source: | ||
| 2/17/2022 | Listed for sale | $340,000+81.8%$122/sqft |
Source: | ||
| 8/28/2020 | Sold | $187,000+3.9%$67/sqft |
Source: | ||
| 8/17/2020 | Pending sale | $179,900$65/sqft |
Source: RE/MAX Legacy #21732104 Report a problem | ||
| 8/15/2020 | Listed for sale | $179,900$65/sqft |
Source: RE/MAX Legacy #21732104 Report a problem | ||
| 1/9/2013 | Listing removed | $1,250 |
Source: RPM Central Indiana Report a problem | ||
| 11/2/2012 | Price change | $1,250-13.8% |
Source: RPM Central Indiana Report a problem | ||
| 10/19/2012 | Listed for rent | $1,450$1/sqft |
Source: RPM Central Indiana Report a problem | ||
| Year | Property taxes | Tax assessment |
|---|---|---|
| 2025 | $3,084 +30.4% | $339,400 +10.1% |
| 2024 | $2,365 -0.3% | $308,400 +30.4% |
| 2023 | $2,371 +12.9% | $236,500 -0.3% |
| 2022 | $2,100 -49.7% | $237,100 +12.9% |
| 2021 | $4,178 +1.6% | $210,000 +0.5% |
| 2020 | $4,112 +5.6% | $208,900 +1.6% |
| 2019 | $3,893 +7.7% | $205,600 +6.3% |
| 2018 | $3,615 +7.5% | $193,400 +7.7% |
| 2017 | $3,363 -0.3% | $179,500 +7.5% |
| 2016 | $3,372 +3.8% | $166,900 +2.8% |
| 2014 | $3,248 +2.7% | $162,400 +2.7% |
| 2013 | $3,164 +1.6% | $158,200 +1.6% |
| 2012 | $3,114 | $155,700 +1.2% |
| 2011 | -- | $153,900 -0.6% |
| 2010 | $4,942 +55.7% | $154,800 -2.5% |
| 2009 | $3,174 | $158,700 |
Find assessor info on the county website
Source: MIBOR as distributed by MLS GRID. This data may not be complete. We recommend contacting the local school district to confirm school assignments for this home.