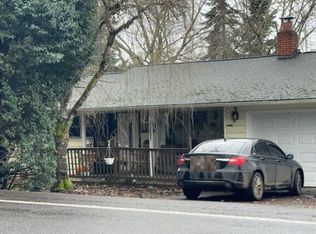
PER MOST RECENT INSPECTION, PROPERTY IS BELIEVED TO BE VACANT - Upcoming Auction Exclusive Xome.com Property. NO BUYER PREMIUM. For information and to register to bid on this property, please visit Xome.com. Foreclosure deed was recorded on 07/2022. The buyer is responsible for all closing costs in this transaction. The buyer has the right to select their own title/closing company. This 1380 square foot single family home has 3 bedrooms and 2.0 bathrooms. This is located in rural area. This home is located close to shopping and dining.
Pre-foreclosure
Est. $424,800
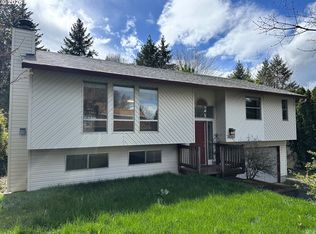
15931 Bluff Rd, Sandy, OR 97055
3beds
1,380sqft
SingleFamily
Built in 1950
0.31 Acres Lot
$424,800 Zestimate®
$308/sqft
$-- HOA
Overview
- 160 days |
- 47 |
- 0 |
Facts & features
Interior
Bedrooms & bathrooms
- Bedrooms: 3
- Bathrooms: 2
- Full bathrooms: 2
Heating
- Forced air
Cooling
- Central
Appliances
- Included: Range / Oven
Features
- Laundry, Wall to Wall Carpet
- Flooring: Carpet
- Has fireplace: Yes
Interior area
- Total interior livable area: 1,380 sqft
Property
Parking
- Total spaces: 1
- Parking features: Garage - Attached
Accessibility
- Accessibility features: One Level*, Garage on Main, Minimal Steps*, Walk in Shower*, Ground Level, Wide Door*, Roll in Shower*, Bathroom Size*, Utility room on main
Features
- Exterior features: Vinyl
Lot
- Size: 0.31 Acres
Details
- Parcel number: 00654884
Construction
Type & style
- Home type: SingleFamily
Materials
- Roof: Composition
Condition
- Year built: 1950
Community & HOA
Location
- Region: Sandy
Financial & listing details
- Price per square foot: $308/sqft
- Tax assessed value: $431,307
- Annual tax amount: $3,323
Visit our professional directory to find a foreclosure specialist in your area that can help with your home search.
Find a foreclosure agentForeclosure details
Estimated market value
$424,800
$382,000 - $467,000
$2,578/mo
Price history
Price history
| Date | Event | Price |
|---|---|---|
| 9/29/2023 | Sold | $344,800+9.4%$250/sqft |
Source: Public Record Report a problem | ||
| 7/28/2022 | Sold | $315,304-9.9%$228/sqft |
Source: Public Record Report a problem | ||
| 7/14/2022 | Listed for sale | $350,000$254/sqft |
Source: John L Scott Real Estate #22144010 Report a problem | ||
| 5/17/2022 | Pending sale | $350,000$254/sqft |
Source: John L Scott Real Estate #22144010 Report a problem | ||
| 4/29/2022 | Listed for sale | $350,000+20.7%$254/sqft |
Source: John L Scott Real Estate #22144010 Report a problem | ||
| 11/20/2017 | Sold | $290,000+1.8%$210/sqft |
Source: Public Record Report a problem | ||
| 9/12/2017 | Pending sale | $284,900$206/sqft |
Source: Mal & Seitz #17639842 Report a problem | ||
| 9/8/2017 | Listed for sale | $284,900+96.5%$206/sqft |
Source: Mal & Seitz #17639842 Report a problem | ||
| 10/27/2011 | Sold | $145,000+14.8%$105/sqft |
Source: Public Record Report a problem | ||
| 8/4/2011 | Listed for sale | $126,350-15.2%$92/sqft |
Source: John L. Scott Portland Metro #11696521 Report a problem | ||
| 5/19/2011 | Sold | $149,000-2.6%$108/sqft |
Source: Public Record Report a problem | ||
| 5/2/2002 | Sold | $153,000+9.3%$111/sqft |
Source: Public Record Report a problem | ||
| 7/26/1999 | Sold | $140,000$101/sqft |
Source: Public Record Report a problem | ||
Public tax history
Public tax history
| Year | Property taxes | Tax assessment |
|---|---|---|
| 2025 | $3,323 +4.4% | $193,677 +3% |
| 2024 | $3,183 +2.7% | $188,036 +3% |
| 2023 | $3,099 +2.8% | $182,560 +3% |
| 2022 | $3,015 +3.6% | $177,243 +3% |
| 2021 | $2,911 +2.8% | $172,081 +3% |
| 2020 | $2,832 +1% | $167,069 +3% |
| 2019 | $2,805 +2.9% | $162,203 +3% |
| 2018 | $2,727 | $157,479 +3% |
| 2017 | $2,727 +6.1% | $152,892 +3% |
| 2016 | $2,569 | $148,439 +3% |
| 2015 | $2,569 +2.9% | $144,116 +3% |
| 2014 | $2,496 +5.6% | $139,918 +3% |
| 2013 | $2,363 +2.2% | $135,843 +3% |
| 2012 | $2,313 +3.5% | $131,886 +3% |
| 2011 | $2,234 +3.1% | $128,045 +3% |
| 2010 | $2,166 +2.8% | $124,316 +3% |
| 2009 | $2,106 +22.5% | $120,695 +3% |
| 2008 | $1,719 +0.7% | $117,180 +3% |
| 2007 | $1,708 +4.8% | $113,767 +3% |
| 2006 | $1,630 +2.8% | $110,453 +3% |
| 2005 | $1,586 +1.4% | $107,236 +3% |
| 2004 | $1,563 +2.3% | $104,113 +3% |
| 2003 | $1,528 +7.3% | $101,081 +3% |
| 2002 | $1,425 +2.7% | $98,137 +3% |
| 2001 | $1,387 +2.9% | $95,279 +3% |
| 2000 | $1,348 | $92,504 |
Find assessor info on the county website
Monthly payment
Estimated monthly payment
All calculations are estimates and provided by Zillow, Inc. for informational purposes only. Actual amounts may vary.
HOA fees may include property taxes on listings classified as Co-Ops. Contact the listing agent and/or owner for fee details.
Mortgage interest rates are dependent on a number of factors, including credit score, down payment, and repayment length. Interest rate data provided by Zillow Group Marketplace, Inc. as of 1/1/1970 from various mortgage lenders with which we have lead or other similar arrangements; the Estimated Payment is an average of those rates.
See how much you could borrow to make a competitive offer.
Climate risks
Neighborhood: 97055
Nearby schools
GreatSchools rating
- 6/10Kelso Elementary SchoolGrades: K-5Distance: 1.8 mi
- 7/10Boring Middle SchoolGrades: 6-8Distance: 5.4 mi
- 5/10Sandy High SchoolGrades: 9-12Distance: 0.3 mi
Schools provided by the listing agent
- Elementary: Kelso
- Middle: Cedar Ridge
- High: Sandy
Source: The MLS. This data may not be complete. We recommend contacting the local school district to confirm school assignments for this home.

- Oregon
- Clackamas County
- Sandy
- 97055
- 15931 Bluff Rd
Nearby cities
Nearby zip codes
Other Sandy Topics
