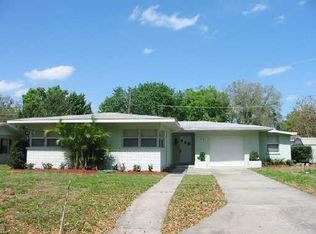
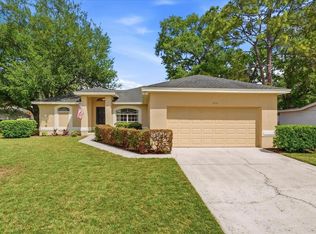
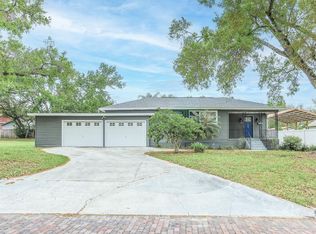
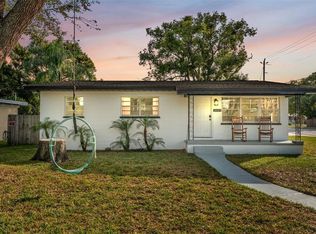
*** POOL HOME *** UPDATED 4 BED 2 BATH 2 CAR GARAGE POOL HOME *** FRESH PAINT, NEW FLOORING, NEW ROOF, NEW APPLIANCE PACKAGE & MUCH MORE *** NICE CORNER LOT WITH CIRCUALAR DRIVE WAY *** BACK YARD OASIS HAS IN GROUND POOL PERFECT FOR HANGING OUT WITH FRIENDS & FAMILY. COME CHECK THIS OUT TODAY.
Pre-foreclosure
Est. $305,400
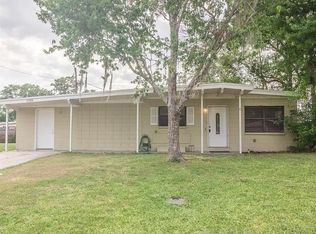
1506 New Jersey Rd, Lakeland, FL 33803
4beds
1,267sqft
Single Family Residence
Built in 1955
10,184 Square Feet Lot
$305,400 Zestimate®
$241/sqft
$-- HOA
Overview
- 40 days |
- 47 |
- 5 |
Originating MLS: Tampa
Facts & features
Interior
Bedrooms & bathrooms
- Bedrooms: 4
- Bathrooms: 2
- Full bathrooms: 2
Heating
- Forced air, Electric
Cooling
- Central
Appliances
- Included: Dishwasher, Microwave, Range / Oven, Refrigerator
Features
- Ceiling Fans(s), Open Floorplan, Built in Features, Other
- Flooring: Tile, Laminate
- Has fireplace: No
Interior area
- Total interior livable area: 1,267 sqft
Property
Parking
- Total spaces: 2
- Parking features: Garage - Attached
Features
- Levels: One
- Exterior features: Other
- Pool features: In Ground
Lot
- Size: 10,184 Square Feet
Details
- Parcel number: 242829252700000150
- Zoning: RA-3
Construction
Type & style
- Home type: SingleFamily
- Property subtype: Single Family Residence
Materials
- masonry
- Foundation: Retaining Wall
- Roof: Shake / Shingle
Condition
- Year built: 1955
Utilities & green energy
- Sewer: Public Sewer
- Water: Public
- Utilities for property: Public
Community & HOA
Community
- Subdivision: SOUTHMOOR SUB
Location
- Region: Lakeland
Financial & listing details
- Price per square foot: $241/sqft
- Tax assessed value: $221,705
- Annual tax amount: $4,003
- Ownership: Fee Simple
Visit our professional directory to find a foreclosure specialist in your area that can help with your home search.
Find a foreclosure agentForeclosure details
Estimated market value
$305,400
$287,000 - $324,000
$2,424/mo
Price history
Price history
| Date | Event | Price |
|---|---|---|
| 4/5/2021 | Sold | $214,900$170/sqft |
Source: Public Record Report a problem | ||
| 2/9/2021 | Pending sale | $214,900$170/sqft |
Source: STAR BAY REALTY CORP. #T3271208 Report a problem | ||
| 2/9/2021 | Listed for sale | $214,900$170/sqft |
Source: STAR BAY REALTY CORP. #T3271208 Report a problem | ||
| 2/9/2021 | Pending sale | $214,900$170/sqft |
Source: | ||
| 1/27/2021 | Price change | $214,900+2.4%$170/sqft |
Source: | ||
| 1/22/2021 | Pending sale | $209,900$166/sqft |
Source: | ||
| 1/14/2021 | Listed for sale | $209,900$166/sqft |
Source: | ||
| 11/6/2020 | Pending sale | $209,900$166/sqft |
Source: STAR BAY REALTY CORP. #T3271208 Report a problem | ||
| 10/19/2020 | Listed for sale | $209,900+49.9%$166/sqft |
Source: STAR BAY REALTY CORP. #T3271208 Report a problem | ||
| 8/3/2020 | Sold | $140,000-6.6%$110/sqft |
Source: Public Record Report a problem | ||
| 7/17/2020 | Pending sale | $149,900$118/sqft |
Source: COLDWELL BANKER REALTY #L4916762 Report a problem | ||
| 7/9/2020 | Listed for sale | $149,900$118/sqft |
Source: COLDWELL BANKER REALTY #L4916762 Report a problem | ||
Public tax history
Public tax history
| Year | Property taxes | Tax assessment |
|---|---|---|
| 2024 | $4,003 +8% | $221,705 +9.1% |
| 2023 | $3,705 +3.5% | $203,218 +4.2% |
| 2022 | $3,581 +55.6% | $194,943 +60.2% |
| 2021 | $2,301 -18.1% | $121,674 -17.4% |
| 2020 | $2,808 +280.9% | $147,297 +82.9% |
| 2019 | $737 | $80,526 +1.9% |
| 2018 | $737 +2.8% | $79,025 +2.1% |
| 2017 | $717 +1.5% | $77,400 +0% |
| 2016 | $707 -1.1% | $77,385 +0.7% |
| 2015 | $715 +8.7% | $76,847 +0.8% |
| 2014 | $657 -3.3% | $76,237 +1.5% |
| 2013 | $680 +1.1% | $75,110 +1.7% |
| 2012 | $673 -5.1% | $73,854 -4% |
| 2011 | $709 -0.1% | $76,908 +1.5% |
| 2010 | $710 +3.3% | $75,771 +2.7% |
| 2009 | $687 +4.9% | $73,779 +0.1% |
| 2008 | $655 | $73,705 |
| 2007 | -- | -- |
| 2006 | $937 | -- |
| 2005 | -- | -- |
| 2004 | $844 -0.8% | -- |
| 2003 | $851 +8.8% | $66,129 +4.9% |
| 2002 | $782 +2.7% | $63,065 +1.6% |
| 2001 | $762 | $62,072 |
Find assessor info on the county website
Monthly payment
Estimated monthly payment
All calculations are estimates and provided by Zillow, Inc. for informational purposes only. Actual amounts may vary.
HOA fees may include property taxes on listings classified as Co-Ops. Contact the listing agent and/or owner for fee details.
Mortgage interest rates are dependent on a number of factors, including credit score, down payment, and repayment length. Interest rate data provided by Zillow Group Marketplace, Inc. as of 1/1/1970 from various mortgage lenders with which we have lead or other similar arrangements; the Estimated Payment is an average of those rates.
See how much you could borrow to make a competitive offer.
Climate risks
Neighborhood: Lake Bentley
Nearby schools
GreatSchools rating
- 1/10Philip O'Brien Elementary SchoolGrades: PK-5Distance: 1.1 mi
- 1/10Crystal Lake Middle SchoolGrades: 6-8Distance: 1.3 mi
- 5/10Lakeland Senior High SchoolGrades: 9-12Distance: 0.8 mi

- Florida
- Polk County
- Lakeland
- 33803
- Lake Bentley
- 1506 New Jersey Rd
Nearby cities
Nearby neighborhoods
Nearby zip codes
Other Lakeland Topics
