$202,000
3 bd|2 ba|1.1k sqft
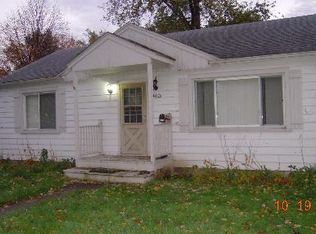
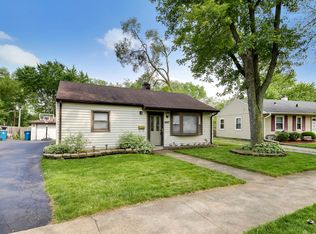
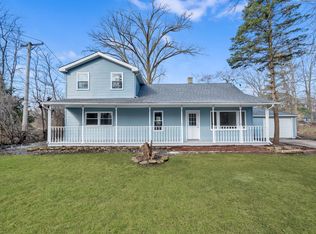
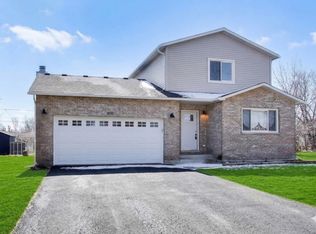
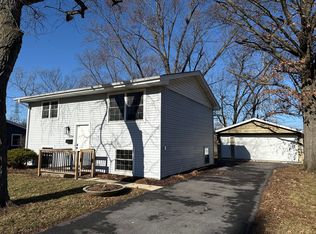
4027 149th St, Midlothian, IL 60445
Sold
Zillow last checked: 7 hours ago
Listing updated: March 08, 2026 at 05:45pm
Katherine Trevino 847-404-0025,
Tanis Group Realty
Not available
Estimated sales range
Not available
Not available
| Date | Event | Price |
|---|---|---|
| 3/9/2026 | Contingent | $249,900$179/sqft |
Source: | ||
| 2/18/2026 | Price change | $249,900-3.8%$179/sqft |
Source: | ||
| 1/8/2026 | Listed for sale | $259,900-1.9%$186/sqft |
Source: | ||
| 1/7/2026 | Listing removed | $264,900$189/sqft |
Source: | ||
| 12/4/2025 | Price change | $264,900-1.5%$189/sqft |
Source: | ||
| 10/27/2025 | Listed for sale | $269,000-0.3%$192/sqft |
Source: | ||
| 9/4/2025 | Listing removed | $269,900$193/sqft |
Source: | ||
| 7/28/2025 | Contingent | $269,900$193/sqft |
Source: | ||
| 7/24/2025 | Listed for sale | $269,900+200.2%$193/sqft |
Source: | ||
| 8/28/2019 | Listing removed | $1,525$1/sqft |
Source: Excel Properties Report a problem | ||
| 8/22/2019 | Price change | $1,525-3.2%$1/sqft |
Source: Excel Properties Report a problem | ||
| 7/16/2019 | Listed for rent | $1,575$1/sqft |
Source: Owner Report a problem | ||
| 5/20/2019 | Listing removed | $89,900$64/sqft |
Source: Applebrook Realty Inc. #10332467 Report a problem | ||
| 5/20/2019 | Pending sale | $89,900+5.8%$64/sqft |
Source: Applebrook Realty Inc. #10332467 Report a problem | ||
| 5/17/2019 | Sold | $85,000-5.5%$61/sqft |
Source: | ||
| 4/5/2019 | Listed for sale | $89,900$64/sqft |
Source: Applebrook Realty Inc. #10332467 Report a problem | ||
| Year | Property taxes | Tax assessment |
|---|---|---|
| 2023 | $5,471 +16.8% | $14,456 +45% |
| 2022 | $4,683 +4% | $9,967 |
| 2021 | $4,502 +1% | $9,967 -3.8% |
| 2020 | $4,456 +34% | $10,358 -6.6% |
| 2019 | $3,326 -20.7% | $11,087 -16.3% |
| 2018 | $4,194 +3.1% | $13,247 |
| 2017 | $4,067 +5.1% | $13,247 +15% |
| 2016 | $3,869 +3.7% | $11,516 |
| 2015 | $3,730 +2.4% | $11,516 |
| 2014 | $3,643 +5.3% | $11,516 -4.7% |
| 2013 | $3,459 +3.2% | $12,086 |
| 2012 | $3,351 +1.4% | $12,086 |
| 2011 | $3,305 -5% | $12,086 -25.4% |
| 2010 | $3,478 +10.1% | $16,192 |
| 2009 | $3,159 +21% | $16,192 -5% |
| 2008 | $2,611 +1.1% | $17,045 +35% |
| 2007 | $2,583 +4% | $12,624 |
| 2006 | $2,484 +15.5% | $12,624 |
| 2005 | $2,150 -4.7% | $12,624 +8.1% |
| 2004 | $2,255 +3.6% | $11,673 |
| 2003 | $2,177 +3% | $11,673 |
| 2002 | $2,113 +6.4% | $11,673 +11.6% |
| 2001 | $1,986 +3.7% | $10,462 |
| 2000 | $1,915 +2.8% | $10,462 |
| 1999 | $1,863 | $10,462 |
Find assessor info on the county website
Source: MRED as distributed by MLS GRID. This data may not be complete. We recommend contacting the local school district to confirm school assignments for this home.