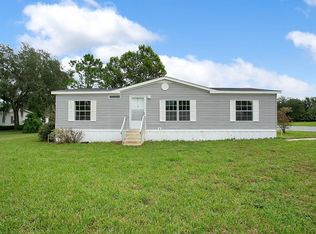
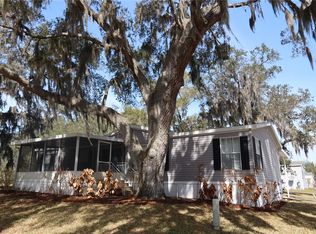
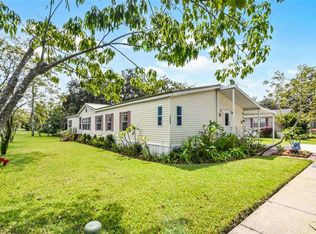
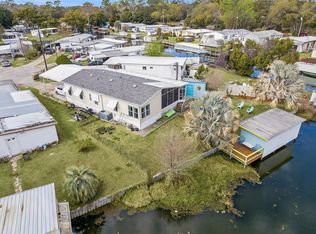
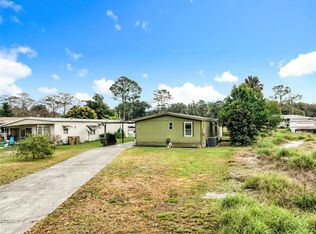
Welcome to this well maintained 3 Bedroom 2 Bath home. The kitchen has lots of cabinets and counter space, with stainless steel appliances. This home has a split floor plan with 16 inch tiled/carpet floors and boasts 1,620 sqft of open living space. The laundry is located inside the home There is a storage shed just outside on the covered screened porch. HOA Fees include water, sewer, and community pool. A public boat ramp to Harris Chain of Lakes is only 1.25 miles away!!
Pre-foreclosure
Est. $227,500
14213 Goldrush Ct, Astatula, FL 34705
3beds
1,620sqft
MobileManufactured
Built in 2005
6,682 Square Feet Lot
$227,500 Zestimate®
$140/sqft
$150/mo HOA
Overview
- 152 days |
- 6 |
- 2 |
Facts & features
Interior
Bedrooms & bathrooms
- Bedrooms: 3
- Bathrooms: 2
- Full bathrooms: 2
Heating
- Forced air, Electric
Cooling
- Central
Appliances
- Included: Dishwasher, Dryer, Microwave, Washer
Interior area
- Total interior livable area: 1,620 sqft
Property
Parking
- Parking features: Carport
Features
- Exterior features: Vinyl
Lot
- Size: 6,682 Square Feet
Details
- Parcel number: 282026130000004900
Construction
Type & style
- Home type: MobileManufactured
Materials
- Frame
- Foundation: Piers
- Roof: Shake / Shingle
Condition
- Year built: 2005
Community & HOA
HOA
- Has HOA: Yes
- HOA fee: $150 monthly
Location
- Region: Astatula
Financial & listing details
- Price per square foot: $140/sqft
- Tax assessed value: $154,237
- Annual tax amount: $3,743
Visit our professional directory to find a foreclosure specialist in your area that can help with your home search.
Find a foreclosure agentForeclosure details
Estimated market value
$227,500
$212,000 - $241,000
$2,097/mo
Price history
Price history
| Date | Event | Price |
|---|---|---|
| 4/8/2022 | Sold | $193,500-0.8%$119/sqft |
Source: Public Record Report a problem | ||
| 3/1/2022 | Pending sale | $195,000$120/sqft |
Source: BHHS broker feed #G5051229 Report a problem | ||
| 2/24/2022 | Listed for sale | $195,000$120/sqft |
Source: BHHS broker feed #G5051229 Report a problem | ||
| 2/16/2022 | Pending sale | $195,000$120/sqft |
Source: BHHS broker feed #G5051229 Report a problem | ||
| 2/13/2022 | Listed for sale | $195,000$120/sqft |
Source: BHHS broker feed #G5051229 Report a problem | ||
| 2/5/2022 | Pending sale | $195,000$120/sqft |
Source: BHHS broker feed #G5051229 Report a problem | ||
| 1/30/2022 | Listed for sale | $195,000+387.5%$120/sqft |
Source: | ||
| 12/10/2009 | Listing removed | $40,000$25/sqft |
Source: foreclosure.com Report a problem | ||
| 11/14/2009 | Price change | $40,000-11.1%$25/sqft |
Source: foreclosure.com Report a problem | ||
| 10/11/2009 | Price change | $45,000-14.9%$28/sqft |
Source: foreclosure.com Report a problem | ||
| 9/12/2009 | Price change | $52,900-8.6%$33/sqft |
Source: foreclosure.com Report a problem | ||
| 8/9/2009 | Price change | $57,900-10.9%$36/sqft |
Source: foreclosure.com Report a problem | ||
| 8/1/2009 | Price change | -- |
Source: foreclosure.com Report a problem | ||
| 6/27/2009 | Price change | $65,000-15.5%$40/sqft |
Source: foreclosure.com Report a problem | ||
| 3/2/2009 | Listed for sale | $76,900+174.6%$47/sqft |
Source: foreclosure.com Report a problem | ||
| 7/20/2005 | Sold | $28,000$17/sqft |
Source: Public Record Report a problem | ||
Public tax history
Public tax history
| Year | Property taxes | Tax assessment |
|---|---|---|
| 2025 | $3,743 -0.9% | $154,237 |
| 2024 | $3,777 +6.4% | $154,237 +2.5% |
| 2023 | $3,550 +248.5% | $150,470 +156.3% |
| 2022 | $1,019 +2.2% | $58,720 +3% |
| 2021 | $997 -3.1% | $57,012 +1.4% |
| 2020 | $1,029 +0.7% | $56,225 +2.3% |
| 2019 | $1,022 +3.5% | $54,961 +1.9% |
| 2018 | $988 | $53,937 +2.1% |
| 2017 | $988 +3.4% | $52,828 +2.1% |
| 2016 | $955 -0.3% | $51,742 +0.7% |
| 2015 | $957 +26.3% | $51,383 +0.8% |
| 2014 | $758 +41.8% | $50,976 -3.1% |
| 2013 | $535 -0.8% | $52,610 |
| 2012 | $539 -5% | $52,610 -5.4% |
| 2011 | $567 -32% | $55,626 -32.9% |
| 2010 | $833 -57.1% | $82,961 -17.9% |
| 2009 | $1,941 -12.7% | $101,035 -12.8% |
| 2008 | $2,224 +32% | $115,843 +2.9% |
| 2007 | $1,685 -5.4% | $112,591 |
| 2006 | $1,782 +319% | $112,591 +429.8% |
| 2005 | $425 +8.7% | $21,252 |
| 2004 | $391 | -- |
Find assessor info on the county website
Monthly payment
Estimated monthly payment
All calculations are estimates and provided by Zillow, Inc. for informational purposes only. Actual amounts may vary.
HOA fees may include property taxes on listings classified as Co-Ops. Contact the listing agent and/or owner for fee details.
Mortgage interest rates are dependent on a number of factors, including credit score, down payment, and repayment length. Interest rate data provided by Zillow Group Marketplace, Inc. as of 1/1/1970 from various mortgage lenders with which we have lead or other similar arrangements; the Estimated Payment is an average of those rates.
See how much you could borrow to make a competitive offer.
Climate risks
Neighborhood: 34705
Nearby schools
GreatSchools rating
- 5/10Astatula Elementary SchoolGrades: PK-5Distance: 0.3 mi
- 5/10Tavares Middle SchoolGrades: 6-8Distance: 4.3 mi
- 4/10Tavares High SchoolGrades: 9-12Distance: 6.7 mi

- Florida
- Lake County
- Astatula
- 34705
- 14213 Goldrush Ct
Nearby cities
Nearby zip codes
Other Astatula Topics
