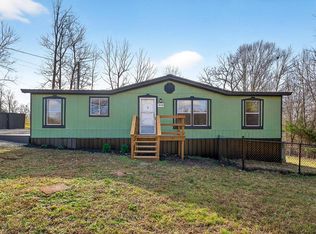
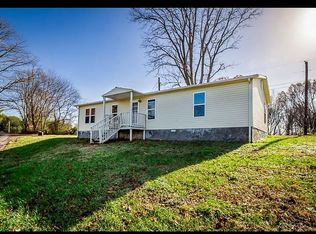
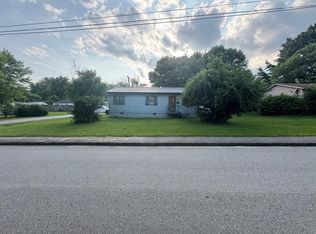
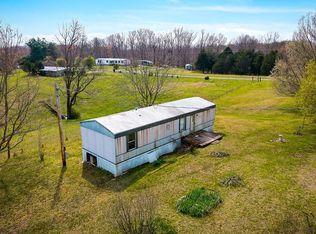
2 mobile homes on 2 road frontages. Close to TN Tech and the hospital. Great rentals or live in one and rent the other. Great investment opportunity. TLC needed. Includes 1230 Phillips Drive.
For sale
$145,000
1398 Shipley Rd, Cookeville, TN 38501
2beds
980sqft
Manufactured Home
Built in 1989
0.64 Acres Lot
$-- Zestimate®
$148/sqft
$-- HOA
What's special
Road frontages
- 906 days |
- 161 |
- 11 |
Zillow last checked: 7 hours ago
Listing updated: November 06, 2025 at 01:38pm
Listed by:
Kelly Morgan,
The Realty Firm 931-520-7750
Source: UCMLS,MLS#: 223662
Facts & features
Interior
Bedrooms & bathrooms
- Bedrooms: 2
- Bathrooms: 1
- Full bathrooms: 1
Appliances
- Included: Electric Water Heater
Features
- Has basement: No
Interior area
- Total structure area: 980
- Total interior livable area: 980 sqft
Property
Parking
- Parking features: None
Features
- Patio & porch: Covered
Lot
- Size: 0.64 Acres
- Dimensions: 0.64 ac
- Features: Corner Lot, Cleared
Details
- Parcel number: 027 121.02
Construction
Type & style
- Home type: MobileManufactured
- Property subtype: Manufactured Home
Materials
- Metal Siding, Frame
- Roof: Metal
Condition
- Year built: 1989
Utilities & green energy
- Sewer: Septic Tank
- Water: Public
- Utilities for property: Natural Gas Available
Community & HOA
Community
- Subdivision: Maddux & Harris
HOA
- Has HOA: No
Location
- Region: Cookeville
Financial & listing details
- Price per square foot: $148/sqft
- Tax assessed value: $23,600
- Annual tax amount: $145
- Date on market: 10/7/2023
- Road surface type: Paved

Kelly Morgan
(931) 349-4492
By pressing Contact Agent, you agree that the real estate professional identified above may call/text you about your search, which may involve use of automated means and pre-recorded/artificial voices. You don't need to consent as a condition of buying any property, goods, or services. Message/data rates may apply. You also agree to our Terms of Use. Zillow does not endorse any real estate professionals. We may share information about your recent and future site activity with your agent to help them understand what you're looking for in a home.
Estimated market value
Not available
Estimated sales range
Not available
Not available
Price history
Price history
| Date | Event | Price |
|---|---|---|
| 2/7/2024 | Price change | $145,000-58%$148/sqft |
Source: | ||
| 2/7/2024 | Price change | $345,000+122.6%$352/sqft |
Source: | ||
| 11/27/2023 | Price change | $155,000-58.7%$158/sqft |
Source: | ||
| 11/27/2023 | Price change | $375,000-3.8%$383/sqft |
Source: | ||
| 10/7/2023 | Price change | $390,000+143.8%$398/sqft |
Source: | ||
| 10/7/2023 | Listed for sale | $160,000+540%$163/sqft |
Source: | ||
| 8/28/1998 | Sold | $25,000+47.1%$26/sqft |
Source: Public Record Report a problem | ||
| 12/6/1996 | Sold | $17,000$17/sqft |
Source: Public Record Report a problem | ||
| 4/22/1996 | Sold | $17,000$17/sqft |
Source: Public Record Report a problem | ||
Public tax history
Public tax history
| Year | Property taxes | Tax assessment |
|---|---|---|
| 2025 | $157 | $5,900 |
| 2024 | $157 | $5,900 |
| 2023 | $157 +7.6% | $5,900 |
| 2022 | $146 | $5,900 -35.2% |
| 2021 | -- | $9,100 +30.5% |
| 2020 | $204 | $6,975 |
| 2019 | $204 +7.2% | $6,975 |
| 2018 | $190 +0.2% | $6,975 |
| 2017 | $190 | $6,975 |
| 2016 | $190 -2.9% | $6,975 |
| 2015 | $196 -34.8% | $6,975 -34.8% |
| 2014 | $300 | $10,697 |
| 2013 | $300 -0.2% | $10,697 |
| 2012 | $301 +6.2% | $10,697 |
| 2011 | $283 | $10,697 |
| 2010 | -- | $10,697 -3% |
| 2009 | $303 | $11,028 |
| 2008 | $303 +7% | $11,028 |
| 2007 | $283 +244.9% | $11,028 +228.8% |
| 2006 | $82 -8.6% | $3,354 -3% |
| 2005 | $90 | $3,456 |
| 2004 | $90 +4.9% | $3,456 |
| 2002 | $86 | $3,456 -50.4% |
| 2001 | -- | $6,970 -60% |
| 2000 | -- | $17,424 |
Find assessor info on the county website
Monthly payment
Estimated monthly payment
All calculations are estimates and provided by Zillow, Inc. for informational purposes only. Actual amounts may vary.
HOA fees may include property taxes on listings classified as Co-Ops. Contact the listing agent and/or owner for fee details.
Mortgage interest rates are dependent on a number of factors, including credit score, down payment, and repayment length. Interest rate data provided by Zillow Group Marketplace, Inc. as of 1/1/1970 from various mortgage lenders with which we have lead or other similar arrangements; the Estimated Payment is an average of those rates.
See how much you could borrow to make a competitive offer.
Climate risks
Neighborhood: 38501
Nearby schools
GreatSchools rating
- 5/10Jere Whitson Elementary SchoolGrades: PK-4Distance: 1.3 mi
- 4/10Avery Trace Middle SchoolGrades: 5-8Distance: 3.5 mi
- 8/10Cookeville High SchoolGrades: PK,9-12Distance: 1.8 mi


- Tennessee
- Putnam County
- Cookeville
- 38501
- 1398 Shipley Rd
Nearby cities
Nearby neighborhoods
Nearby zip codes
Other Cookeville Topics
