$569,400
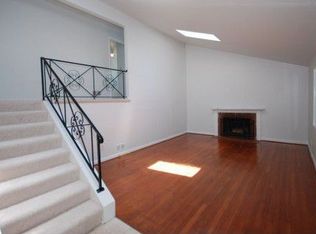
4 bd|2 ba|1.6k sqft
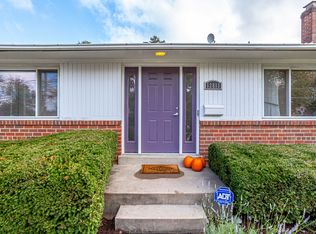
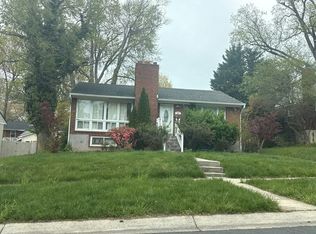
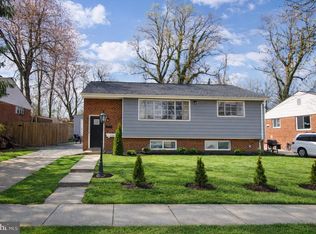
12805 Crisfield Rd, Silver Spring, MD 20906
Off Market

Zillow last checked:
Listing updated:
Jose Bautista 301-537-5656,
RE/MAX Excellence Realty 301-445-5900
$504,800
$475,000 - $535,000
$3,084/mo
| Date | Event | Price |
|---|---|---|
| 5/28/2021 | Sold | $387,000$230/sqft |
Source: | ||
| 3/31/2021 | Pending sale | $387,000-7.6%$230/sqft |
Source: | ||
| 9/11/2015 | Listing removed | $2,100$1/sqft |
Source: Long & Foster Real Estate, Inc. #MC8720957 Report a problem | ||
| 8/14/2015 | Listed for rent | $2,100-4.3%$1/sqft |
Source: Long & Foster Real Estate, Inc. #MC8720957 Report a problem | ||
| 4/8/2014 | Listing removed | $2,195$1/sqft |
Source: Long and Foster Real Estate, Inc. Report a problem | ||
| 1/9/2014 | Price change | $2,195-0.2%$1/sqft |
Source: Long and Foster Real Estate Inc Report a problem | ||
| 11/20/2013 | Listed for rent | $2,200$1/sqft |
Source: Long and Foster Real Estate, Inc. Report a problem | ||
| 7/24/2008 | Listing removed | $419,000$249/sqft |
Source: Long and Foster Real Estate #MC6740313 Report a problem | ||
| 5/27/2008 | Listed for sale | $419,000+2.2%$249/sqft |
Source: Long and Foster Real Estate #MC6740313 Report a problem | ||
| 3/31/2005 | Sold | $409,999+42.6%$244/sqft |
Source: Public Record Report a problem | ||
| 1/8/2003 | Sold | $287,500+51.3%$171/sqft |
Source: Public Record Report a problem | ||
| 7/11/2002 | Sold | $190,000+21.8%$113/sqft |
Source: Public Record Report a problem | ||
| 4/21/1998 | Sold | $156,000$93/sqft |
Source: Public Record Report a problem | ||
| Year | Property taxes | Tax assessment |
|---|---|---|
| 2025 | $4,994 +10.8% | $422,800 +8% |
| 2024 | $4,505 +8.6% | $391,367 +8.7% |
| 2023 | $4,147 +14.4% | $359,933 +9.6% |
| 2022 | $3,625 +1.8% | $328,500 +1.7% |
| 2021 | $3,560 +1.7% | $322,900 +1.8% |
| 2020 | $3,500 +3% | $317,300 +1.8% |
| 2019 | $3,398 -0.2% | $311,700 +1.1% |
| 2018 | $3,404 -2.4% | $308,167 +1.2% |
| 2017 | $3,487 +7.5% | $304,633 +1.2% |
| 2016 | $3,245 | $301,100 +4.6% |
| 2015 | $3,245 | $287,933 +4.8% |
| 2014 | $3,245 | $274,767 +5% |
| 2013 | -- | $261,600 |
| 2012 | -- | $261,600 |
| 2011 | -- | $261,600 -38.8% |
| 2010 | -- | $427,590 +7.9% |
| 2009 | -- | $396,392 +8.5% |
| 2008 | -- | $365,196 +9.3% |
| 2007 | -- | $334,000 +18.1% |
| 2006 | -- | $282,726 +22.2% |
| 2005 | -- | $231,453 +28.5% |
| 2004 | -- | $180,180 |
| 2003 | -- | $180,180 +11.2% |
| 2002 | -- | $162,020 +5.9% |
| 2001 | -- | $152,940 |
Find assessor info on the county website
Source: Bright MLS. This data may not be complete. We recommend contacting the local school district to confirm school assignments for this home.
A local agent can set up tours, give advice and negotiate with sellers.