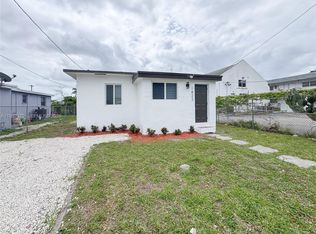
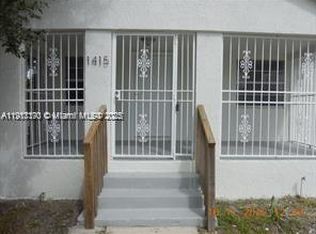
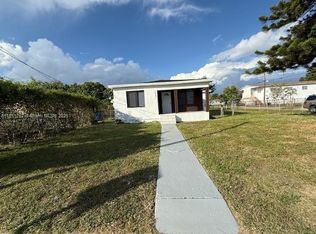
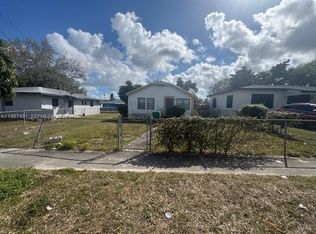
This 1109 square foot single family home has 3 bedrooms and 1.0 bathrooms. This home is located at 1260 NW 68th St, Miami, FL 33147.
Pre-foreclosure
Street View
Est. $401,000
1260 NW 68th St, Miami, FL 33147
3beds
1,109sqft
SingleFamily
Built in 1950
5,401 Square Feet Lot
$401,000 Zestimate®
$362/sqft
$-- HOA
Overview
- 205 days |
- 13 |
- 0 |
Facts & features
Interior
Bedrooms & bathrooms
- Bedrooms: 3
- Bathrooms: 1
- Full bathrooms: 1
Heating
- Forced air
Cooling
- Central
Appliances
- Included: Range / Oven, Refrigerator
Features
- First Floor Entry
- Flooring: Carpet
Interior area
- Total interior livable area: 1,109 sqft
Property
Features
- Exterior features: Other
Lot
- Size: 5,401 Square Feet
Details
- Parcel number: 0131140200040
Construction
Type & style
- Home type: SingleFamily
Materials
- concrete
- Roof: Other
Condition
- Year built: 1950
Community & HOA
Location
- Region: Miami
Financial & listing details
- Price per square foot: $362/sqft
- Tax assessed value: $279,072
- Annual tax amount: $4,857
Visit our professional directory to find a foreclosure specialist in your area that can help with your home search.
Find a foreclosure agentForeclosure details
Estimated market value
$401,000
$369,000 - $433,000
$2,635/mo
Price history
Price history
| Date | Event | Price |
|---|---|---|
| 12/19/2018 | Sold | $200,000$180/sqft |
Source: Public Record Report a problem | ||
| 9/28/2018 | Sold | $200,000-4.7%$180/sqft |
Source: Agent Provided Report a problem | ||
| 8/2/2018 | Pending sale | $209,900$189/sqft |
Source: American King Realty LLC #A10456003 Report a problem | ||
| 7/10/2018 | Listed for sale | $209,900$189/sqft |
Source: American King Realty LLC #A10456003 Report a problem | ||
| 7/9/2018 | Pending sale | $209,900$189/sqft |
Source: American King Realty LLC #A10456003 Report a problem | ||
| 6/18/2018 | Listed for sale | $209,900$189/sqft |
Source: American King Realty LLC #A10456003 Report a problem | ||
| 6/16/2018 | Pending sale | $209,900$189/sqft |
Source: American King Realty LLC #A10456003 Report a problem | ||
| 6/13/2018 | Price change | $209,900+25%$189/sqft |
Source: American King Realty LLC #A10456003 Report a problem | ||
| 4/26/2018 | Price change | $167,900-6.7%$151/sqft |
Source: American King Realty LLC #A10456003 Report a problem | ||
| 4/20/2018 | Listed for sale | $179,999+33.2%$162/sqft |
Source: American King Realty LLC #A10456003 Report a problem | ||
| 4/19/2018 | Sold | $135,100+59.1%$122/sqft |
Source: Public Record Report a problem | ||
| 4/22/2016 | Listing removed | $84,900$77/sqft |
Source: The R.E. Resource Grp., Inc. #A2153285 Report a problem | ||
| 11/25/2015 | Pending sale | $84,900$77/sqft |
Source: The R.E. Resource Grp., Inc. #A2153285 Report a problem | ||
| 10/28/2015 | Price change | $84,900-15%$77/sqft |
Source: The R.E. Resource Grp., Inc. #A2153285 Report a problem | ||
| 9/30/2015 | Price change | $99,900-9.1%$90/sqft |
Source: The R.E. Resource Grp., Inc. #A2153285 Report a problem | ||
| 8/31/2015 | Listed for sale | $109,900$99/sqft |
Source: The R.E. Resource Grp., Inc. #A2153285 Report a problem | ||
Public tax history
Public tax history
| Year | Property taxes | Tax assessment |
|---|---|---|
| 2024 | $4,857 +6.9% | $196,189 +10% |
| 2023 | $4,546 +11.4% | $178,354 +7.3% |
| 2022 | $4,081 +12.1% | $166,184 +10% |
| 2021 | $3,641 +10.2% | $151,077 +10% |
| 2020 | $3,305 +6.8% | $137,343 +8% |
| 2019 | $3,095 +76.4% | $127,170 +139.3% |
| 2018 | $1,754 | $53,139 +10% |
| 2017 | $1,754 +13.7% | $48,309 +10% |
| 2016 | $1,543 +16.3% | $43,918 +10% |
| 2015 | $1,326 +7.2% | $39,926 +10% |
| 2014 | $1,237 +4.2% | $36,297 +10% |
| 2013 | $1,187 | $32,998 -7.7% |
| 2012 | $1,187 -30.1% | $35,733 -38.4% |
| 2011 | $1,699 -19.8% | $57,976 -19.3% |
| 2010 | $2,119 -33.5% | $71,825 -41.5% |
| 2009 | $3,188 -6.4% | $122,779 -11.7% |
| 2007 | $3,406 +32.1% | $139,081 |
| 2006 | $2,578 | -- |
| 2005 | $2,578 +22.4% | -- |
| 2004 | $2,107 +288.3% | -- |
| 2003 | $543 +6.9% | -- |
| 2002 | $508 | -- |
| 2001 | $508 | -- |
Find assessor info on the county website
Monthly payment
Estimated monthly payment
All calculations are estimates and provided by Zillow, Inc. for informational purposes only. Actual amounts may vary.
HOA fees may include property taxes on listings classified as Co-Ops. Contact the listing agent and/or owner for fee details.
Mortgage interest rates are dependent on a number of factors, including credit score, down payment, and repayment length. Interest rate data provided by Zillow Group Marketplace, Inc. as of 1/1/1970 from various mortgage lenders with which we have lead or other similar arrangements; the Estimated Payment is an average of those rates.
See how much you could borrow to make a competitive offer.
Climate risks
Neighborhood: Liberty City
Nearby schools
GreatSchools rating
- 4/10Holmes Elementary SchoolGrades: PK-5Distance: 0.1 mi
- 3/10Brownsville Middle SchoolGrades: 6-8Distance: 1.6 mi
- 2/10Miami Northwestern Senior High SchoolGrades: 9-12Distance: 0.3 mi

- Florida
- Miami-Dade County
- Miami
- 33147
- Liberty City
- 1260 NW 68th St
Nearby cities
Nearby neighborhoods
Nearby zip codes
Other Miami Topics
