This property will be sold through the applicable foreclosure auction process. The property is being sold "as is" and the occupancy status is assumed to be occupied. The buyer assumes all responsibility for the property condition and occupancy.
Pre-foreclosure
Est. $605,300
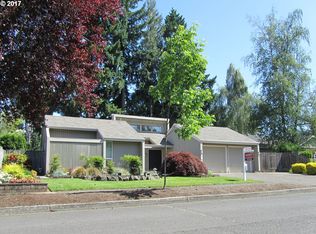
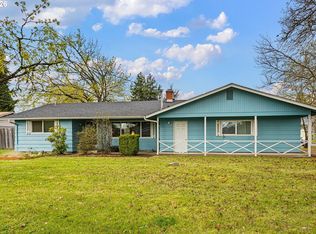
1255 Rio Glen Dr, Eugene, OR 97401
4beds
2,265sqft
SingleFamily
Built in 1976
8,276 Square Feet Lot
$605,300 Zestimate®
$267/sqft
$-- HOA
Overview
- 82 days |
- 27 |
- 2 |
Facts & features
Interior
Bedrooms & bathrooms
- Bedrooms: 4
- Bathrooms: 3
- Full bathrooms: 2
- 1/2 bathrooms: 1
Heating
- None, Other
Features
- Basement: Finished
- Has fireplace: Yes
Interior area
- Total interior livable area: 2,265 sqft
Property
Parking
- Parking features: Garage - Attached
Features
- Exterior features: Wood
Lot
- Size: 8,276 Square Feet
Details
- Parcel number: 0166361
Construction
Type & style
- Home type: SingleFamily
Materials
- Roof: Composition
Condition
- Year built: 1976
Community & HOA
Location
- Region: Eugene
Financial & listing details
- Price per square foot: $267/sqft
- Tax assessed value: $631,238
- Annual tax amount: $6,261
Visit our professional directory to find a foreclosure specialist in your area that can help with your home search.
Find a foreclosure agentForeclosure details
Estimated market value
$605,300
$563,000 - $654,000
$3,342/mo
Price history
Price history
| Date | Event | Price |
|---|---|---|
| 6/26/1998 | Sold | $175,000$77/sqft |
Source: Public Record Report a problem | ||
Public tax history
Public tax history
| Year | Property taxes | Tax assessment |
|---|---|---|
| 2025 | $6,261 +1.3% | $321,320 +3% |
| 2024 | $6,183 +2.6% | $311,962 +3% |
| 2023 | $6,025 +4% | $302,876 +3% |
| 2022 | $5,792 +6.5% | $294,055 +3% |
| 2021 | $5,440 -0.4% | $285,491 +3% |
| 2020 | $5,459 +3.5% | $277,176 +3% |
| 2019 | $5,273 +6.2% | $269,103 +3% |
| 2018 | $4,963 | $261,266 +3% |
| 2017 | $4,963 +4.7% | $253,656 +3% |
| 2016 | $4,741 +3.6% | $246,268 +3% |
| 2015 | $4,578 +3.6% | $239,095 +3% |
| 2014 | $4,418 +8.2% | $232,131 +3% |
| 2013 | $4,082 +10.9% | $225,370 +3% |
| 2012 | $3,681 | $218,806 +3% |
| 2011 | -- | $212,433 +3% |
| 2010 | -- | $206,246 +3% |
| 2009 | -- | $200,239 +3% |
| 2008 | -- | $194,407 +3% |
| 2007 | -- | $188,745 +3% |
| 2006 | -- | $183,248 +3% |
| 2005 | -- | $177,911 +3% |
| 2004 | -- | $172,729 +3% |
| 2003 | -- | $167,698 +3% |
| 2002 | -- | $162,814 +3% |
| 2001 | -- | $158,072 +3% |
| 2000 | -- | $153,468 |
Find assessor info on the county website
Monthly payment
Estimated monthly payment
All calculations are estimates and provided by Zillow, Inc. for informational purposes only. Actual amounts may vary.
HOA fees may include property taxes on listings classified as Co-Ops. Contact the listing agent and/or owner for fee details.
Mortgage interest rates are dependent on a number of factors, including credit score, down payment, and repayment length. Interest rate data provided by Zillow Group Marketplace, Inc. as of 1/1/1970 from various mortgage lenders with which we have lead or other similar arrangements; the Estimated Payment is an average of those rates.
See how much you could borrow to make a competitive offer.
Climate risks
Neighborhood: Cal Young
Nearby schools
GreatSchools rating
- 5/10Willagillespie Elementary SchoolGrades: K-5Distance: 0.5 mi
- 5/10Cal Young Middle SchoolGrades: 6-8Distance: 1.2 mi
- 6/10Sheldon High SchoolGrades: 9-12Distance: 1.1 mi


- Oregon
- Lane County
- Eugene
- 97401
- Cal Young
- 1255 Rio Glen Dr
Nearby cities
Nearby neighborhoods
Nearby zip codes
Other Eugene Topics
