$147,200
3 bd|1 ba|1k sqft
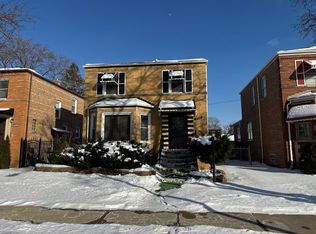
12455 S State St, Chicago, IL 60628
Off Market
Zillow last checked: 7 hours ago
Listing updated: January 17, 2026 at 02:04am
Trehanel Newton (312)815-2267,
eXp Realty
Not available
Estimated sales range
Not available
Not available
| Date | Event | Price |
|---|---|---|
| 1/16/2026 | Pending sale | $140,000$112/sqft |
Source: | ||
| 12/16/2025 | Price change | $140,000-12.5%$112/sqft |
Source: | ||
| 11/30/2025 | Listed for sale | $160,000+88.2%$128/sqft |
Source: | ||
| 9/27/2021 | Listing removed | -- |
Source: | ||
| 9/14/2021 | Listed for sale | $85,000$68/sqft |
Source: | ||
| 8/13/2021 | Contingent | $85,000$68/sqft |
Source: | ||
| 7/26/2021 | Price change | $85,000-14.9%$68/sqft |
Source: | ||
| 7/20/2021 | Listed for sale | $99,900-21.3%$80/sqft |
Source: | ||
| 11/21/2020 | Listing removed | $126,900$102/sqft |
Source: Parkvue Realty Corporation #10893281 Report a problem | ||
| 11/18/2020 | Price change | $126,900-2.3%$102/sqft |
Source: Parkvue Realty Corporation #10893281 Report a problem | ||
| 10/9/2020 | Listed for sale | $129,900+457.8%$104/sqft |
Source: Parkvue Realty Corporation #10893281 Report a problem | ||
| 6/14/2016 | Sold | $23,289+5.9%$19/sqft |
Source: | ||
| 5/4/2016 | Price change | -- |
Source: Owners.com #09191996 Report a problem | ||
| 4/13/2016 | Listed for sale | $22,000-82.3%$18/sqft |
Source: REALHome Services and Solutions #09191996 Report a problem | ||
| 8/10/2006 | Sold | $124,000+42.5%$99/sqft |
Source: Public Record Report a problem | ||
| 3/24/2004 | Sold | $87,000+85.1%$70/sqft |
Source: Public Record Report a problem | ||
| 9/12/2001 | Sold | $47,000$38/sqft |
Source: Public Record Report a problem | ||
| Year | Property taxes | Tax assessment |
|---|---|---|
| 2023 | $2,115 +2.5% | $9,999 |
| 2022 | $2,063 +2.3% | $9,999 |
| 2021 | $2,016 -4.3% | $9,999 +6% |
| 2020 | $2,106 -0.2% | $9,431 -10% |
| 2019 | $2,111 +1.7% | $10,479 |
| 2018 | $2,075 -15.3% | $10,479 -7.7% |
| 2017 | $2,449 +7.5% | $11,350 |
| 2016 | $2,279 +9.3% | $11,350 |
| 2015 | $2,085 +10.5% | $11,350 +11.9% |
| 2014 | $1,887 +2% | $10,144 |
| 2013 | $1,849 +1.4% | $10,144 |
| 2012 | $1,824 -7.7% | $10,144 -16.7% |
| 2011 | $1,977 -0.4% | $12,176 |
| 2010 | $1,985 +4.4% | $12,176 |
| 2009 | $1,902 +6.7% | $12,176 -1.8% |
| 2008 | $1,782 +1.1% | $12,400 |
| 2007 | $1,763 -1.1% | $12,400 |
| 2006 | $1,782 +44.6% | $12,400 +32.4% |
| 2005 | $1,233 +2.5% | $9,364 |
| 2004 | $1,203 +14.1% | $9,364 |
| 2003 | $1,054 -5.4% | $9,364 +16.9% |
| 2002 | $1,114 -19.9% | $8,013 |
| 2001 | $1,390 +39.5% | $8,013 |
| 2000 | $996 +0.6% | $8,013 +11.6% |
| 1999 | $990 | $7,178 |
Find assessor info on the county website
Source: MRED as distributed by MLS GRID. This data may not be complete. We recommend contacting the local school district to confirm school assignments for this home.