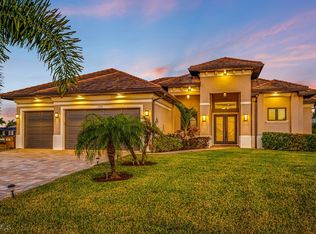
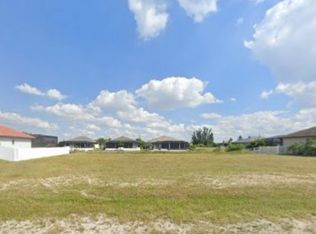
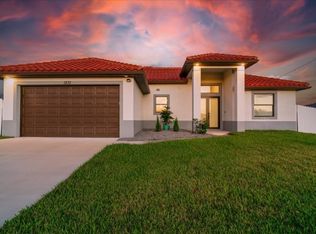
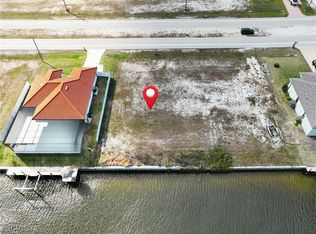
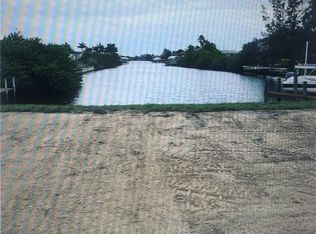
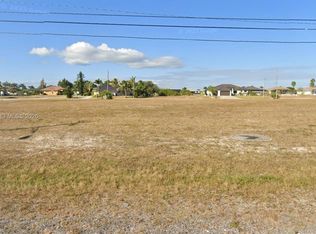
Beautiful Gulf access lot in fast growing NW Cape Coral, with a brand new Concrete seawall and Concrete dock. Land is cleared and ready to build your new home! Hurry with your offer before it is gone.
Active
Price cut: $10K (4/1)
$189,900
1223 Old Burnt Store Rd N, Cape Coral, FL 33993
--beds
--baths
10,018.8Square Feet
Unimproved Land
Built in ----
10,018.8 Square Feet Lot
$-- Zestimate®
$--/sqft
$-- HOA
What's special
Gulf access lot
- 205 days |
- 53 |
- 0 |
Zillow last checked: 7 hours ago
Listing updated: April 01, 2026 at 07:50am
Listed by:
German Vite 239-257-7336,
Pro Management Realty
Source: Florida Gulf Coast MLS,MLS#: 2025011003 Originating MLS: Florida Gulf Coast
Facts & features
Interior
Video & virtual tour
Property
Features
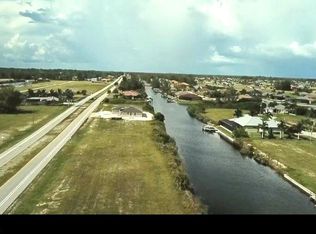
- Has view: Yes
- View description: Canal
- Has water view: Yes
- Water view: Canal
- Waterfront features: Canal Access, Navigable Water, Seawall
Lot
- Size: 10,018.8 Square Feet
- Dimensions: 80 x 125 x 80 x 125
- Features: Rectangular Lot
Details
- Parcel number: 064423C104256.0190
- Lease amount: $0
- Zoning description: R1-W
Utilities & green energy
- Sewer: None
- Water: None
- Utilities for property: None, Sewer Not Available, Water Not Available
Community & HOA
Community
- Features: None
- Condo and coop fee: $0
- Membership fee: $0
- Subdivision: CAPE CORAL
HOA
- Services included: None
Location
- Region: Cape Coral
Financial & listing details
- Tax assessed value: $161,500
- Annual tax amount: $3,042
- Date on market: 9/17/2025
- Cumulative days on market: 206 days
- Listing terms: All Financing Considered,Cash
- Road surface type: Paved
Estimated market value
Not available
Estimated sales range
Not available
$2,709/mo
Price history
Price history
| Date | Event | Price |
|---|---|---|
| 4/1/2026 | Price change | $189,900-5% |
Source: | ||
| 3/22/2026 | Price change | $199,900-20% |
Source: | ||
| 9/17/2025 | Listed for sale | $249,900-2% |
Source: | ||
| 7/16/2025 | Listing removed | $255,000 |
Source: | ||
| 2/4/2025 | Listed for sale | $255,000-12.1% |
Source: | ||
| 2/5/2024 | Listing removed | -- |
Source: | ||
| 10/23/2023 | Price change | $290,000-3% |
Source: | ||
| 9/19/2023 | Price change | $299,000-3.2% |
Source: | ||
| 8/3/2023 | Listed for sale | $309,000+54.5% |
Source: | ||
| 7/8/2022 | Sold | $200,000-8.7% |
Source: | ||
| 6/7/2022 | Pending sale | $219,000 |
Source: | ||
| 6/3/2022 | Listed for sale | $219,000+239.5% |
Source: | ||
| 4/14/2021 | Sold | $64,500-0.8% |
Source: Public Record Report a problem | ||
| 1/21/2021 | Pending sale | $65,000 |
Source: | ||
| 1/21/2021 | Listed for sale | $65,000+622.2% |
Source: | ||
| 4/1/2002 | Sold | $9,000 |
Source: Public Record Report a problem | ||
Public tax history
Public tax history
| Year | Property taxes | Tax assessment |
|---|---|---|
| 2025 | $3,063 +0.7% | $161,500 -1.8% |
| 2024 | $3,043 -14% | $164,501 -16% |
| 2023 | $3,540 +73% | $195,824 +105.8% |
| 2022 | $2,046 +54.9% | $95,144 +69.9% |
| 2021 | $1,321 +4.9% | $56,000 +8.9% |
| 2020 | $1,260 +4.9% | $51,446 -6.5% |
| 2019 | $1,201 | $55,000 |
| 2018 | $1,201 +2.8% | $55,000 |
| 2017 | $1,168 +4.7% | $55,000 |
| 2016 | $1,116 +4.6% | $55,000 +5.8% |
| 2015 | $1,067 +6.1% | $52,000 +30% |
| 2014 | $1,006 +17.8% | $40,000 +40.8% |
| 2013 | $854 +39.8% | $28,400 +18.3% |
| 2012 | $611 -24.2% | $24,000 -27.3% |
| 2011 | $806 -21% | $33,000 -21.4% |
| 2010 | $1,021 +2.9% | $42,000 |
| 2009 | $992 -31.1% | $42,000 -47.5% |
| 2008 | $1,440 -47.7% | $80,000 -48.4% |
| 2007 | $2,755 -40.2% | $155,000 -38.7% |
| 2006 | $4,609 +154.2% | $253,000 +200.7% |
| 2004 | $1,813 +30.4% | $84,150 +37.5% |
| 2003 | $1,391 +201.6% | $61,200 +225.2% |
| 2002 | $461 | $18,820 +107% |
| 2000 | -- | $9,090 |
Find assessor info on the county website
Monthly payment
Estimated monthly payment
All calculations are estimates and provided by Zillow, Inc. for informational purposes only. Actual amounts may vary.
HOA fees may include property taxes on listings classified as Co-Ops. Contact the listing agent and/or owner for fee details.
Mortgage interest rates are dependent on a number of factors, including credit score, down payment, and repayment length. Interest rate data provided by Zillow Group Marketplace, Inc. as of 1/1/1970 from various mortgage lenders with which we have lead or other similar arrangements; the Estimated Payment is an average of those rates.
See how much you could borrow to make a competitive offer.
Climate risks
Neighborhood: 33993
Nearby schools
GreatSchools rating
- 5/10Trafalgar Elementary SchoolGrades: PK-5Distance: 4.7 mi
- 3/10Mariner Middle SchoolGrades: 6-8Distance: 3.2 mi
- 3/10Mariner High SchoolGrades: 9-12Distance: 3.2 mi
Local experts in 33993


- Florida
- Lee County
- Cape Coral
- 33993
- 1223 Old Burnt Store Rd N
Nearby cities
Nearby neighborhoods
Nearby zip codes
Other Cape Coral Topics
