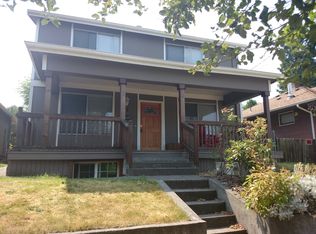
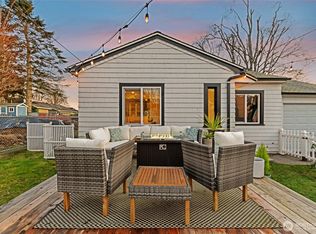
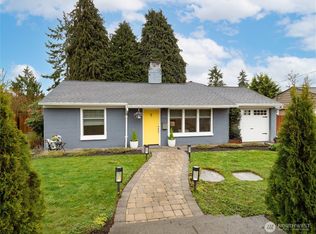
This 1130 square foot single family home has 2 bedrooms and 1.0 bathrooms. This home is located at 119 N 83rd St, Seattle, WA 98103.
Pre-foreclosure
Est. $857,900
119 N 83rd St, Seattle, WA 98103
2beds
1baths
1,130sqft
SingleFamily
Built in 1916
3,840 Square Feet Lot
$857,900 Zestimate®
$759/sqft
$-- HOA
Overview
- 31 days |
- 42 |
- 0 |
Facts & features
Interior
Bedrooms & bathrooms
- Bedrooms: 2
- Bathrooms: 1
Heating
- Forced air
Features
- Basement: Partially finished
- Has fireplace: Yes
Interior area
- Total interior livable area: 1,130 sqft
Property
Lot
- Size: 3,840 Square Feet
Details
- Parcel number: 2919200960
Construction
Type & style
- Home type: SingleFamily
Condition
- Year built: 1916
Community & HOA
Location
- Region: Seattle
Financial & listing details
- Price per square foot: $759/sqft
- Tax assessed value: $827,000
- Annual tax amount: $8,195
Visit our professional directory to find a foreclosure specialist in your area that can help with your home search.
Find a foreclosure agentForeclosure details
Estimated market value
$857,900
$781,000 - $935,000
$2,553/mo
Price history
Price history
| Date | Event | Price |
|---|---|---|
| 2/29/2000 | Sold | $261,000+50.9%$231/sqft |
Source: | ||
| 1/21/1997 | Sold | $172,950$153/sqft |
Source: Public Record Report a problem | ||
Public tax history
Public tax history
| Year | Property taxes | Tax assessment |
|---|---|---|
| 2024 | $8,195 +11.8% | $827,000 +10.3% |
| 2023 | $7,333 +2.2% | $750,000 -8.6% |
| 2022 | $7,178 +3.5% | $821,000 +12.3% |
| 2021 | $6,938 +13.5% | $731,000 +20.4% |
| 2020 | $6,114 -3.2% | $607,000 -4.9% |
| 2019 | $6,320 +9.6% | $638,000 -1.5% |
| 2018 | $5,767 -2.5% | $648,000 +11.7% |
| 2017 | $5,915 +32.8% | $580,000 +13.9% |
| 2016 | $4,453 | $509,000 +10.7% |
| 2015 | $4,453 | $460,000 +2% |
| 2014 | $4,453 | $451,000 +8.4% |
| 2013 | $4,453 | $416,000 +13.7% |
| 2012 | -- | $366,000 -2.1% |
| 2011 | -- | $374,000 +0.8% |
| 2010 | -- | $371,000 |
| 2009 | -- | $371,000 +1.4% |
| 2007 | -- | $366,000 +7% |
| 2006 | -- | $342,000 +9.3% |
| 2005 | -- | $313,000 +37.3% |
| 2001 | $2,715 +6.5% | $228,000 +12.3% |
| 2000 | $2,549 | $203,000 |
Find assessor info on the county website
BuyAbility℠ payment
Estimated monthly payment
All calculations are estimates and provided by Zillow, Inc. for informational purposes only. Actual amounts may vary.
HOA fees may include property taxes on listings classified as Co-Ops. Contact the listing agent and/or owner for fee details.
Mortgage interest rates are dependent on a number of factors, including credit score, down payment, and repayment length. Interest rate data provided by Zillow Group Marketplace, Inc. as of 1/1/1970 from various mortgage lenders with which we have lead or other similar arrangements; the Estimated Payment is an average of those rates.
See how much you could borrow to make a competitive offer.
Boost your down payment with 6% savings match
Earn up to a 6% match & get a competitive APY with a *. Zillow has partnered with to help get you home faster.
Learn more*Terms apply. Match provided by Foyer. Account offered by Pacific West Bank, Member FDIC.Climate risks
Neighborhood: Greenwood
Nearby schools
GreatSchools rating
- 9/10Greenwood Elementary SchoolGrades: PK-5Distance: 0.2 mi
- 9/10Robert Eagle Staff Middle SchoolGrades: 6-8Distance: 0.9 mi
- 10/10Ballard High SchoolGrades: 9-12Distance: 1.2 mi
- Washington
- King County
- Seattle
- 98103
- Greenwood
- 119 N 83rd St
Nearby cities
Nearby neighborhoods
Nearby zip codes
Other Seattle Topics
