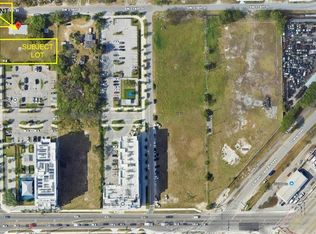
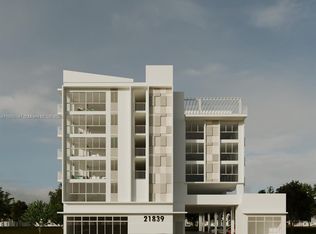
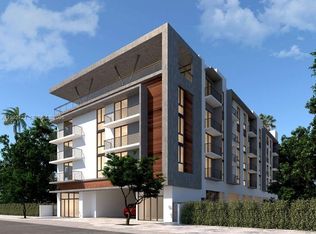
Vacant Land | Zoned for 90 Units. Two parcels totaling 24,559 SF in Miami-Dade Rapid Transit Zone. Eligible to match the tallest approved height within a 1-mile radius—nearby developments reach up to 25 stories. There is a potential opportunity for additional units to be developed; however, this is not confirmed and buyers must conduct their own due diligence to determine.
Lot/land
$2,500,000
11892 SW 214th St, Miami, FL 33177
--beds
--baths
0.56Acres
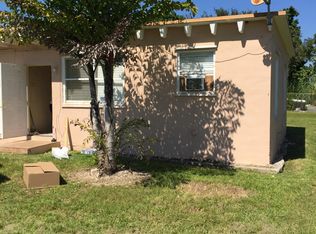
Unimproved Land
Built in ----
0.56 Acres Lot
$-- Zestimate®
$--/sqft
$-- HOA
What's special
- 78 days |
- 42 |
- 2 |
Zillow last checked: 7 hours ago
Listing updated: January 29, 2026 at 09:10am
Listed by:
Andres Rivas 305-562-2662,
R1S1 KM Investment Corp
Source: MIAMI,MLS#: A11944446 Originating MLS: A-Miami Association of REALTORS
Facts & features
Interior
Video & virtual tour
Property
Lot
- Size: 0.56 Acres
- Features: Other
- Residential vegetation: Mango
Details
- Additional structures: Livable, Other Bldg Incl
- Has additional parcels: Yes
- Parcel number: 3069120000320
- Zoning: 3161
Community & HOA
Community
- Subdivision: Randolph Acres
HOA
- Has HOA: No
Location
- Region: Miami
Financial & listing details
- Tax assessed value: $381,758
- Annual tax amount: $7,710
- Date on market: 1/13/2026
- Listing terms: All Cash,Conventional,Owner Will Carry
Estimated market value
Not available
Estimated sales range
Not available
Not available
Price history
Price history
| Date | Event | Price |
|---|---|---|
| 1/13/2026 | Listed for sale | $2,500,000+449.5% |
Source: | ||
| 7/3/2023 | Sold | $455,000-30% |
Source: Public Record Report a problem | ||
| 5/24/2022 | Sold | $650,000-16.1% |
Source: | ||
| 5/24/2022 | Pending sale | $775,000 |
Source: | ||
| 3/17/2022 | Price change | $775,000-48.3% |
Source: | ||
| 1/26/2022 | Listed for sale | $1,500,000+172.7% |
Source: | ||
| 1/18/2022 | Listing removed | -- |
Source: | ||
| 11/2/2021 | Price change | $550,000-15.4% |
Source: | ||
| 10/6/2021 | Listed for sale | $650,000+30% |
Source: | ||
| 9/1/2021 | Listing removed | -- |
Source: | ||
| 6/23/2021 | Price change | $500,000-66.7% |
Source: | ||
| 4/23/2021 | Listed for sale | $1,500,000 |
Source: | ||
| 4/9/2021 | Pending sale | $1,500,000 |
Source: | ||
| 2/22/2021 | Price change | $1,500,000+130.8% |
Source: | ||
| 8/31/2020 | Price change | $650,000-13.3% |
Source: Brown Realty Group, Inc. #A10919621 Report a problem | ||
| 7/30/2020 | Price change | $750,000-50% |
Source: Brown Realty Group, Inc. #A10823973 Report a problem | ||
| 3/5/2020 | Price change | $1,500,000+130.8% |
Source: Brown Realty Group, Inc. #A10823973 Report a problem | ||
| 2/26/2020 | Listed for sale | $650,000 |
Source: Brown Realty Group, Inc. #A10823973 Report a problem | ||
Public tax history
Public tax history
| Year | Property taxes | Tax assessment |
|---|---|---|
| 2024 | $7,218 +25.1% | $381,758 +26.4% |
| 2023 | $5,770 +47.1% | $301,987 +107.4% |
| 2022 | $3,923 +15.5% | $145,626 +10% |
| 2021 | $3,396 +15.8% | $132,388 +10% |
| 2020 | $2,934 +9.3% | $120,353 +10% |
| 2019 | $2,684 +10.7% | $109,412 +10% |
| 2018 | $2,425 | $99,466 +10% |
| 2017 | $2,425 +13.3% | $90,424 +10% |
| 2016 | $2,141 +13.8% | $82,204 +8.2% |
| 2015 | $1,881 +4.7% | $75,977 +10% |
| 2014 | $1,798 -4.1% | $69,070 -1% |
| 2013 | $1,874 | $69,758 -6.3% |
| 2012 | $1,874 -10.8% | $74,471 -10.7% |
| 2011 | $2,101 +2.3% | $83,362 +10% |
| 2010 | $2,053 -22.2% | $75,784 -33.2% |
| 2009 | $2,638 -8.1% | $113,494 -11.9% |
| 2007 | $2,870 +22.3% | $128,763 |
| 2006 | $2,346 | -- |
| 2005 | $2,346 +38.3% | -- |
| 2004 | $1,696 +15.4% | -- |
| 2003 | $1,470 +12.7% | -- |
| 2002 | $1,304 | -- |
| 2001 | $1,304 | -- |
Find assessor info on the county website
Monthly payment
Estimated monthly payment
All calculations are estimates and provided by Zillow, Inc. for informational purposes only. Actual amounts may vary.
HOA fees may include property taxes on listings classified as Co-Ops. Contact the listing agent and/or owner for fee details.
Mortgage interest rates are dependent on a number of factors, including credit score, down payment, and repayment length. Interest rate data provided by Zillow Group Marketplace, Inc. as of 1/1/1970 from various mortgage lenders with which we have lead or other similar arrangements; the Estimated Payment is an average of those rates.
See how much you could borrow to make a competitive offer.
Climate risks
Neighborhood: Goulds
Nearby schools
GreatSchools rating
- 6/10Caribbean Elementary SchoolGrades: PK-8Distance: 0.8 mi
- 3/10Miami Southridge Senior High SchoolGrades: 8-12Distance: 1.3 mi
- 5/10Cutler Bay MiddleGrades: 6-8Distance: 2.6 mi
Local experts in 33177


- Florida
- Miami-Dade County
- Miami
- 33177
- Goulds
- 11892 SW 214th St
Nearby cities
Nearby neighborhoods
Nearby zip codes
Other Miami Topics
