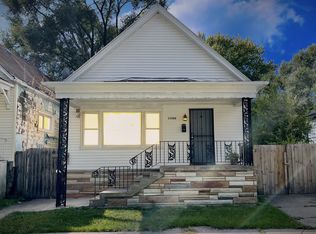
$25,000
4 bd|2 ba|1.6k sqft
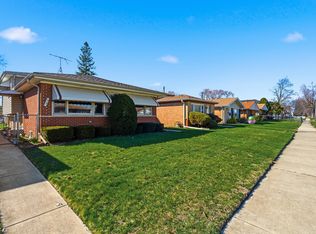
11546 S State St, Chicago, IL 60628
Off Market
Zillow last checked: 7 hours ago
Listing updated: March 11, 2026 at 01:20pm
Elvia Padilla (312)838-3879,
RE/MAX Mi Casa
$180,300
$171,000 - $189,000
$3,436/mo
| Date | Event | Price |
|---|---|---|
| 12/1/2025 | Price change | $179,900-4.8%$108/sqft |
Source: | ||
| 10/12/2025 | Listed for sale | $189,000$113/sqft |
Source: | ||
| 10/8/2025 | Contingent | $189,000$113/sqft |
Source: | ||
| 9/26/2025 | Listed for sale | $189,000+18.1%$113/sqft |
Source: | ||
| 9/25/2025 | Listing removed | $160,000$96/sqft |
Source: | ||
| 9/19/2025 | Listed for sale | $160,000+128.9%$96/sqft |
Source: | ||
| 3/8/2025 | Listing removed | $69,900$42/sqft |
Source: | ||
| 3/4/2025 | Price change | $69,900-2.8%$42/sqft |
Source: | ||
| 3/2/2025 | Price change | $71,900-4%$43/sqft |
Source: | ||
| 2/20/2025 | Price change | $74,900-5.2%$45/sqft |
Source: | ||
| 2/16/2025 | Price change | $79,000-1.1%$47/sqft |
Source: | ||
| 2/9/2025 | Listed for sale | $79,900+6.5%$48/sqft |
Source: | ||
| 12/14/2024 | Listing removed | -- |
Source: Owner Report a problem | ||
| 11/20/2024 | Listed for sale | $75,000-46.4%$45/sqft |
Source: Owner Report a problem | ||
| 8/15/2006 | Sold | $140,000+80.6%$84/sqft |
Source: Public Record Report a problem | ||
| 4/4/2006 | Sold | $77,500+93.8%$46/sqft |
Source: Public Record Report a problem | ||
| 2/11/1997 | Sold | $40,000$24/sqft |
Source: Public Record Report a problem | ||
| Year | Property taxes | Tax assessment |
|---|---|---|
| 2023 | $740 +2.5% | $3,500 |
| 2022 | $722 +2.3% | $3,500 |
| 2021 | $706 -51.3% | $3,500 -46.1% |
| 2020 | $1,450 +86.1% | $6,495 -11% |
| 2019 | $779 +1.9% | $7,298 |
| 2018 | $765 -55.4% | $7,298 -35.5% |
| 2017 | $1,714 -21% | $11,318 -14.9% |
| 2016 | $2,168 +10.6% | $13,298 |
| 2015 | $1,961 +15.5% | $13,298 +13.7% |
| 2014 | $1,697 +2.7% | $11,693 |
| 2013 | $1,652 -21.4% | $11,693 |
| 2012 | $2,103 -2% | $11,693 -11.5% |
| 2011 | $2,145 -0.4% | $13,209 |
| 2010 | $2,154 +4.4% | $13,209 |
| 2009 | $2,064 -14.5% | $13,209 -21.3% |
| 2008 | $2,413 +1.1% | $16,790 |
| 2007 | $2,387 -1.1% | $16,790 |
| 2006 | $2,414 +118% | $16,790 +52.9% |
| 2005 | $1,107 +1.9% | $10,981 |
| 2004 | $1,087 +4.4% | $10,981 |
| 2003 | $1,041 -27.1% | $10,981 +38.4% |
| 2002 | $1,428 +72% | $7,934 |
| 2001 | $830 +94.5% | $7,934 |
| 2000 | $427 +4.1% | $7,934 +48.9% |
| 1999 | $410 | $5,329 |
Find assessor info on the county website
Source: MRED as distributed by MLS GRID. This data may not be complete. We recommend contacting the local school district to confirm school assignments for this home.