$263,100
3 bd|2 ba|1.2k sqft
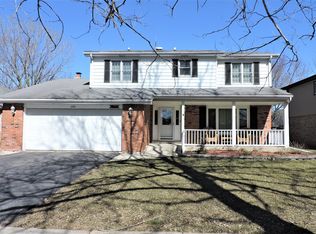
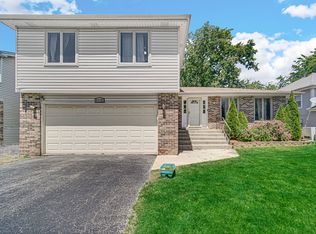
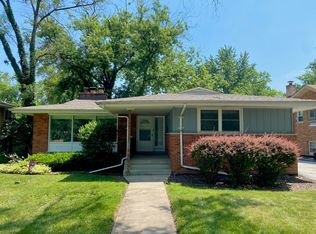
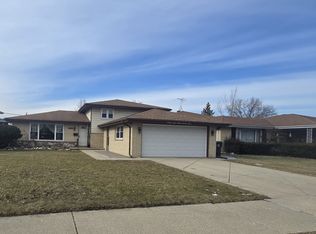
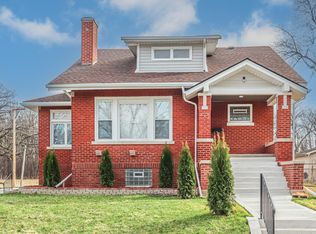
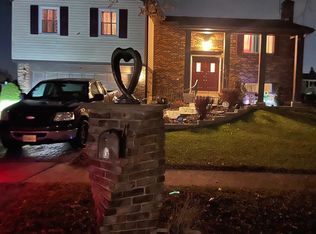
1106 186th St, Homewood, IL 60430
Off Market
Zillow last checked: 7 hours ago
Listing updated: March 20, 2026 at 10:06pm
Jerrell Dantzler (312)388-6889,
Real People Realty
Not available
Estimated sales range
Not available
Not available
| Date | Event | Price |
|---|---|---|
| 3/15/2026 | Price change | $305,000-3.2%$133/sqft |
Source: | ||
| 3/2/2026 | Price change | $315,000-3.1%$138/sqft |
Source: | ||
| 2/22/2026 | Price change | $325,000-3%$142/sqft |
Source: | ||
| 2/11/2026 | Listed for sale | $335,000+119%$146/sqft |
Source: | ||
| 12/30/2013 | Sold | $153,000-1.2%$67/sqft |
Source: | ||
| 11/23/2013 | Pending sale | $154,900$68/sqft |
Source: Keller Williams Preferred Realty #08333411 Report a problem | ||
| 11/13/2013 | Price change | $154,900-3.1%$68/sqft |
Source: Keller Williams Preferred Realty #08333411 Report a problem | ||
| 10/22/2013 | Listed for sale | $159,900$70/sqft |
Source: Keller Williams Preferred Realty #08333411 Report a problem | ||
| 10/17/2013 | Pending sale | $159,900$70/sqft |
Source: Keller Williams Preferred Realty #08333411 Report a problem | ||
| 9/24/2013 | Price change | $159,900-4.8%$70/sqft |
Source: Keller Williams Preferred Realty #08333411 Report a problem | ||
| 9/17/2013 | Pending sale | $168,000$73/sqft |
Source: Keller Williams Preferred Realty #08333411 Report a problem | ||
| 7/2/2013 | Price change | $168,000-6.7%$73/sqft |
Source: Keller Williams Preferred Realty #08333411 Report a problem | ||
| 5/4/2013 | Listed for sale | $180,000+5.9%$79/sqft |
Source: Keller Williams Preferred Realty #08333411 Report a problem | ||
| 11/13/2008 | Sold | $170,000$74/sqft |
Source: Public Record Report a problem | ||
| Year | Property taxes | Tax assessment |
|---|---|---|
| 2023 | $11,029 +23.5% | $30,000 +45.1% |
| 2022 | $8,927 +6.7% | $20,676 |
| 2021 | $8,368 +1.6% | $20,676 |
| 2020 | $8,236 -10.9% | $20,676 -7.9% |
| 2019 | $9,243 -3.8% | $22,458 -6% |
| 2018 | $9,609 -0.6% | $23,889 |
| 2017 | $9,663 +39% | $23,889 +41.2% |
| 2016 | $6,954 -16.6% | $16,918 -15.6% |
| 2015 | $8,335 +1.6% | $20,036 |
| 2014 | $8,204 +32.1% | $20,036 +17.9% |
| 2013 | $6,211 +1.1% | $17,000 |
| 2012 | $6,145 +3.7% | $17,000 |
| 2011 | $5,925 -22.7% | $17,000 -29.1% |
| 2010 | $7,663 +4% | $23,981 |
| 2009 | $7,370 +20.3% | $23,981 -5% |
| 2008 | $6,124 +1.2% | $25,244 +7.7% |
| 2007 | $6,051 +3.1% | $23,431 |
| 2006 | $5,867 +6.7% | $23,431 |
| 2005 | $5,498 +0.1% | $23,431 +22.7% |
| 2004 | $5,495 -0.2% | $19,096 |
| 2003 | $5,504 +3.9% | $19,096 |
| 2002 | $5,300 +20.2% | $19,096 +14.7% |
| 2001 | $4,409 -7.5% | $16,647 |
| 2000 | $4,767 +3% | $16,647 -5.2% |
| 1999 | $4,629 | $17,561 |
Find assessor info on the county website
Source: MRED as distributed by MLS GRID. This data may not be complete. We recommend contacting the local school district to confirm school assignments for this home.