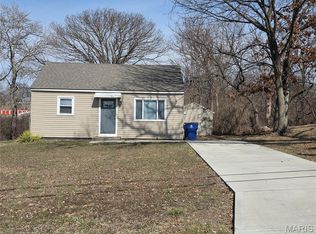
$126,200
3 bd|1 ba|977 sqft
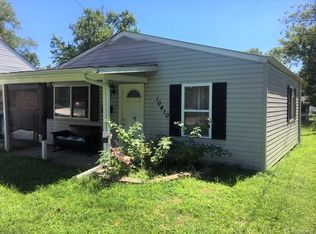
10410 Lackland Rd, Saint Louis, MO 63114
Off Market
Zillow last checked: 7 hours ago
Listing updated: March 12, 2026 at 06:36am
Jonathan Minerick 888-400-2513,
HomeCoin.com
Not available
Estimated sales range
Not available
$1,422/mo
| Date | Event | Price |
|---|---|---|
| 3/12/2026 | Pending sale | $115,000$140/sqft |
Source: | ||
| 3/6/2026 | Listed for sale | $115,000$140/sqft |
Source: | ||
| 3/4/2026 | Pending sale | $115,000$140/sqft |
Source: | ||
| 3/2/2026 | Listed for sale | $115,000-4.2%$140/sqft |
Source: | ||
| 1/7/2026 | Listing removed | $120,000$146/sqft |
Source: | ||
| 12/17/2025 | Pending sale | $120,000$146/sqft |
Source: | ||
| 12/10/2025 | Price change | $120,000-4%$146/sqft |
Source: | ||
| 11/24/2025 | Price change | $125,000-3.8%$152/sqft |
Source: | ||
| 11/14/2025 | Listed for sale | $129,900+18.2%$158/sqft |
Source: | ||
| 11/6/2025 | Listing removed | -- |
Source: Owner Report a problem | ||
| 11/1/2025 | Listed for sale | $109,900+141.5%$133/sqft |
Source: Owner Report a problem | ||
| 3/24/2021 | Listing removed | -- |
Source: Owner Report a problem | ||
| 11/15/2018 | Listing removed | $830$1/sqft |
Source: Owner Report a problem | ||
| 11/5/2018 | Listed for rent | $830$1/sqft |
Source: Owner Report a problem | ||
| 8/28/2015 | Sold | -- |
Source: | ||
| 7/18/2015 | Price change | $45,500-8.1%$55/sqft |
Source: RE/MAX Stars #15002347 Report a problem | ||
| 6/12/2015 | Price change | $49,500-4.8%$60/sqft |
Source: RE/MAX Stars #15002347 Report a problem | ||
| 5/22/2015 | Price change | $52,000-5.5%$63/sqft |
Source: RE/MAX Stars #15002347 Report a problem | ||
| 4/8/2015 | Price change | $55,000-8.3%$67/sqft |
Source: RE/MAX Stars #15002347 Report a problem | ||
| 1/15/2015 | Listed for sale | $60,000$73/sqft |
Source: RE/MAX STARS #15002347 Report a problem | ||
| Year | Property taxes | Tax assessment |
|---|---|---|
| 2025 | $1,590 +3.1% | $20,620 +15.1% |
| 2024 | $1,542 +2.2% | $17,920 |
| 2023 | $1,509 +31.5% | $17,920 +50.7% |
| 2022 | $1,147 +0% | $11,890 |
| 2021 | $1,147 +3.9% | $11,890 +12.7% |
| 2020 | $1,104 -1.6% | $10,550 |
| 2019 | $1,123 | $10,550 +8.1% |
| 2018 | $1,123 | $9,760 |
| 2017 | $1,123 +4.8% | $9,760 +1.9% |
| 2016 | $1,071 +3.8% | $9,580 |
| 2015 | $1,033 | $9,580 +7.4% |
| 2014 | $1,033 +6.6% | $8,920 |
| 2013 | $969 | $8,920 -27% |
| 2012 | -- | $12,220 |
| 2011 | -- | $12,220 -6.9% |
| 2010 | $1,193 +9.4% | $13,130 |
| 2009 | $1,090 -0.7% | $13,130 -10.3% |
| 2008 | $1,098 +20.2% | $14,630 |
| 2007 | $914 | $14,630 +38.7% |
| 2006 | $914 +4.3% | $10,550 |
| 2005 | $877 +11.5% | $10,550 +19.9% |
| 2003 | $786 +4.2% | $8,800 +2% |
| 2002 | $754 +20.8% | $8,630 |
| 2001 | $624 | $8,630 |
Find assessor info on the county website
Source: MARIS. This data may not be complete. We recommend contacting the local school district to confirm school assignments for this home.