$322,700
2 bd|1 ba|-- sqft
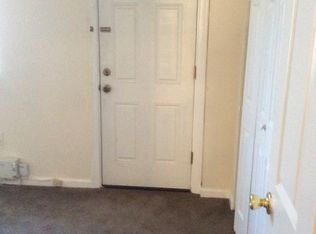
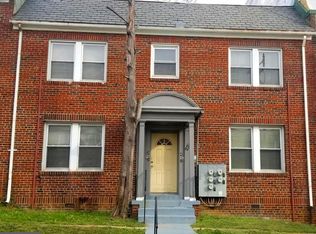
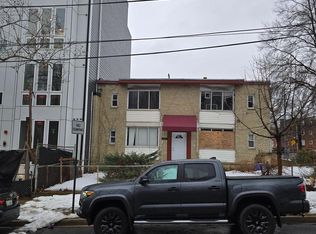
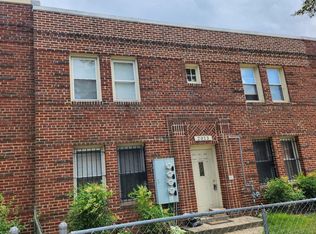
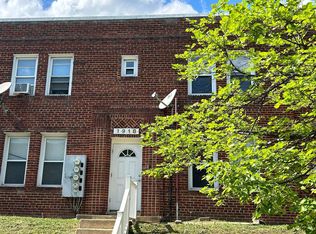
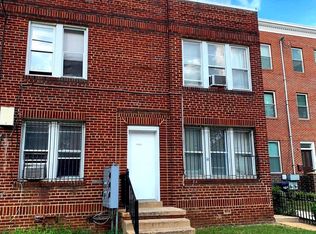
1019 18th St NE APT 3, Washington, DC 20002
Off Market
Zillow last checked: 7 hours ago
Listing updated: March 18, 2026 at 10:19am
Christian Barreiro 202-534-3003,
Horvath & Tremblay MD, LLC
Not available
Estimated sales range
Not available
Not available
| Date | Event | Price |
|---|---|---|
| 3/26/2025 | Listing removed | $1,500,000+349.1%$437/sqft |
Source: | ||
| 3/29/2024 | Sold | $334,000-77.7%$97/sqft |
Source: Public Record Report a problem | ||
| 2/14/2024 | Price change | $1,500,000-11.8%$437/sqft |
Source: | ||
| 5/16/2022 | Pending sale | $1,699,995$496/sqft |
Source: | ||
| 2/15/2022 | Listing removed | $1,699,995$496/sqft |
Source: | ||
| 2/12/2022 | Listed for sale | $1,699,995+6.2%$496/sqft |
Source: | ||
| 1/1/2021 | Listing removed | -- |
Source: | ||
| 5/31/2020 | Listed for sale | $1,600,000+167.1%$467/sqft |
Source: Century 21 Redwood Realty #DCDC470808 Report a problem | ||
| 7/18/2016 | Sold | $599,000-7.8%$175/sqft |
Source: Public Record Report a problem | ||
| 4/18/2016 | Price change | $649,900-4.4%$190/sqft |
Source: Long & Foster Real Estate, Inc. #DC9630449 Report a problem | ||
| 3/21/2016 | Listed for sale | $680,000+70.1%$198/sqft |
Source: Long & Foster Real Estate, Inc. #DC9630449 Report a problem | ||
| 1/15/2016 | Sold | $399,790-38.5%$117/sqft |
Source: Public Record Report a problem | ||
| 11/1/2015 | Listed for sale | $650,000+36.8%$190/sqft |
Source: Long & Foster Real Estate, Inc. #DC9511210 Report a problem | ||
| 1/13/2015 | Sold | $475,000$139/sqft |
Source: Public Record Report a problem | ||
| Year | Property taxes | Tax assessment |
|---|---|---|
| 2025 | $49,473 -1.2% | $989,460 -1.2% |
| 2024 | $50,097 +6.6% | $1,001,940 +6.6% |
| 2023 | $46,974 -47.3% | $939,480 +5.4% |
| 2022 | $89,153 +1226.5% | $891,530 +12.8% |
| 2021 | $6,721 -81.4% | $790,670 +9.4% |
| 2020 | $36,134 +672.7% | $722,670 +31.4% |
| 2018 | $4,676 +7.3% | $550,120 +7.3% |
| 2017 | $4,359 +28.3% | $512,860 +28.3% |
| 2016 | $3,398 +14.7% | $399,790 +14.7% |
| 2015 | $2,963 +31.1% | $348,620 +31.1% |
| 2014 | $2,261 +9.1% | $265,990 +9.1% |
| 2013 | $2,072 -12.2% | $243,820 -12.2% |
| 2012 | $2,361 | $277,770 |
| 2011 | $2,361 -24% | $277,770 -24% |
| 2010 | $3,106 -15.1% | $365,410 -15.1% |
| 2009 | $3,659 +13.1% | $430,440 +17.1% |
| 2007 | $3,235 +196.6% | $367,620 +59.3% |
| 2006 | $1,091 -11.1% | $230,750 +39.1% |
| 2005 | $1,227 -16% | $165,830 +9% |
| 2004 | $1,460 +24.2% | $152,100 +24.2% |
| 2003 | $1,176 +3% | $122,480 +3% |
| 2002 | $1,142 -21.5% | $118,912 -6% |
| 2001 | $1,455 | $126,502 |
Find assessor info on the county website
Earn up to a 6% match & get a competitive APY with a *. Zillow has partnered with to help get you home faster.
Learn more*Terms apply. Match provided by Foyer. Account offered by Pacific West Bank, Member FDIC.Source: Bright MLS. This data may not be complete. We recommend contacting the local school district to confirm school assignments for this home.