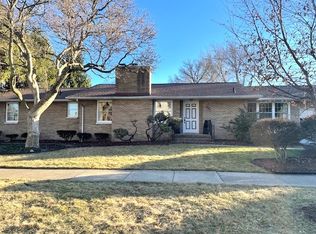
$387,800
3 bd|2 ba|1.8k sqft
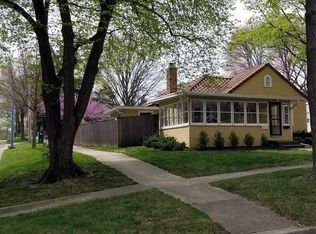
1001 W William St, Champaign, IL 61821
Off Market
Likely to sell faster than
Zillow last checked: 7 hours ago
Listing updated: March 23, 2026 at 08:36am
Trent Meacham 217-417-0960,
Realty Select One
Not available
Estimated sales range
Not available
Not available
| Date | Event | Price |
|---|---|---|
| 3/23/2026 | Contingent | $319,000$175/sqft |
Source: | ||
| 3/6/2026 | Price change | $319,000-4.1%$175/sqft |
Source: | ||
| 2/4/2026 | Listed for sale | $332,500+0.8%$183/sqft |
Source: | ||
| 11/4/2024 | Listing removed | $329,900$181/sqft |
Source: | ||
| 10/29/2024 | Price change | $329,900-3.7%$181/sqft |
Source: | ||
| 10/26/2024 | Listing removed | $2,495$1/sqft |
Source: Zillow Rentals Report a problem | ||
| 10/25/2024 | Price change | $2,495-5.8%$1/sqft |
Source: Zillow Rentals Report a problem | ||
| 10/16/2024 | Price change | $342,500-2.1%$188/sqft |
Source: | ||
| 10/16/2024 | Price change | $2,650-1.9%$1/sqft |
Source: Zillow Rentals Report a problem | ||
| 10/15/2024 | Price change | $2,700-9.2%$1/sqft |
Source: Zillow Rentals Report a problem | ||
| 10/4/2024 | Listed for rent | $2,975-7%$2/sqft |
Source: Zillow Rentals Report a problem | ||
| 10/2/2024 | Price change | $349,900-2.8%$192/sqft |
Source: | ||
| 9/25/2024 | Listing removed | $3,200$2/sqft |
Source: Zillow Rentals Report a problem | ||
| 9/16/2024 | Listed for sale | $359,900+60%$198/sqft |
Source: | ||
| 8/30/2024 | Listed for rent | $3,200$2/sqft |
Source: Zillow Rentals Report a problem | ||
| 6/6/2024 | Sold | $225,000+12.6%$124/sqft |
Source: | ||
| 5/10/2024 | Pending sale | $199,900$110/sqft |
Source: | ||
| 5/8/2024 | Listed for sale | $199,900$110/sqft |
Source: | ||
| Year | Property taxes | Tax assessment |
|---|---|---|
| 2024 | $6,188 +7.8% | $81,960 +9.8% |
| 2023 | $5,740 +7.9% | $74,650 +8.4% |
| 2022 | $5,321 +2.9% | $68,860 +2% |
| 2021 | $5,173 +5.9% | $67,510 +5% |
| 2020 | $4,886 +6.5% | $64,290 +2.1% |
| 2019 | $4,587 | $62,970 +1.6% |
| 2018 | $4,587 +4.5% | $61,980 +4% |
| 2017 | $4,391 +12.1% | $59,590 +2.1% |
| 2016 | $3,918 | $58,370 +1.8% |
| 2015 | $3,918 +0.5% | $57,330 |
| 2014 | $3,898 +0.9% | $57,330 |
| 2013 | $3,862 -0.7% | $57,330 -2% |
| 2012 | $3,888 +0.4% | $58,500 |
| 2011 | $3,875 +0.5% | $58,500 -5.4% |
| 2010 | $3,857 | $61,810 |
| 2009 | -- | $61,810 |
| 2008 | -- | $61,810 +2.9% |
| 2007 | $3,725 +5.6% | $60,070 +6.3% |
| 2006 | $3,528 +7.5% | $56,500 +9.7% |
| 2005 | $3,283 +10% | $51,490 +3.9% |
| 2004 | $2,985 +1.4% | $49,560 +9.3% |
| 2003 | $2,944 +5.7% | $45,350 +8.8% |
| 2002 | $2,785 +8.7% | $41,670 +6.9% |
| 2001 | $2,562 +7.5% | $38,970 +6.3% |
| 2000 | $2,383 | $36,660 |
Find assessor info on the county website
Source: MRED as distributed by MLS GRID. This data may not be complete. We recommend contacting the local school district to confirm school assignments for this home.