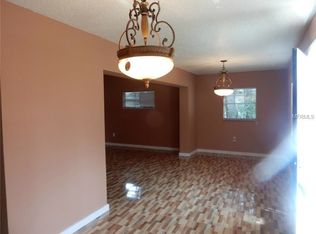
Great rental property its a 1/1 duplex has a large walk in closets located inside of bathroom, large outside porch private. your are responsible for your own water and power, No on site laundry. The garage is off limits. There are stairs leading toward upstairs to apartment.
Pre-foreclosure
Est. $237,500
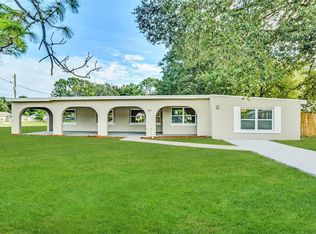
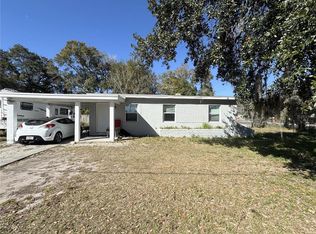
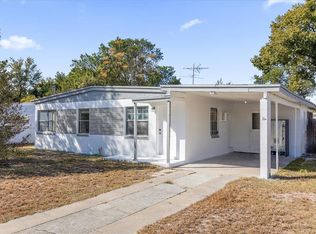
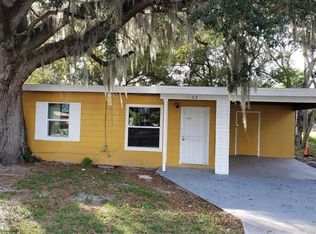
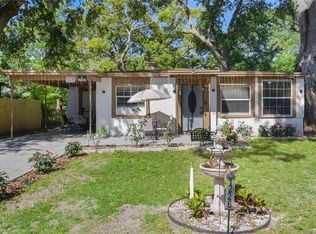
1000 San Domingo Rd, Orlando, FL 32808
1beds
1baths
552sqft
MultiFamily
Built in 1953
-- sqft lot
$237,500 Zestimate®
$430/sqft
$179/mo HOA
Overview
- 277 days |
- 3 |
- 0 |
Facts & features
Interior
Bedrooms & bathrooms
- Bedrooms: 1
- Bathrooms: 1
Heating
- Wall
Cooling
- Central
Appliances
- Included: Range / Oven, Refrigerator
Features
- Flooring: Tile, Laminate
Interior area
- Total interior livable area: 552 sqft
Property
Parking
- Parking features: Garage - Attached
Features
- Exterior features: Stucco
Lot
- Size: 9,966 Square Feet
Details
- Parcel number: 292219694606010
Construction
Type & style
- Home type: MultiFamily
Materials
- masonry
- Roof: Composition
Condition
- Year built: 1953
Community & HOA
HOA
- Has HOA: Yes
- HOA fee: $179 monthly
Location
- Region: Orlando
Financial & listing details
- Price per square foot: $430/sqft
- Tax assessed value: $216,837
- Annual tax amount: $3,399
Visit our professional directory to find a foreclosure specialist in your area that can help with your home search.
Find a foreclosure agentForeclosure details
Estimated market value
$237,500
$202,000 - $283,000
$1,053/mo
Price history
Price history
| Date | Event | Price |
|---|---|---|
| 7/29/2019 | Listing removed | $800$1/sqft |
Source: A2Z REALTY GROUP #O5794701 Report a problem | ||
| 7/5/2019 | Listed for rent | $800-33.3%$1/sqft |
Source: A2Z REALTY GROUP #O5794701 Report a problem | ||
| 6/4/2019 | Sold | $144,900-19.5%$263/sqft |
Source: Public Record Report a problem | ||
| 1/17/2018 | Listing removed | $1,200$2/sqft |
Source: StoneBridge Property Management Group, Inc. Report a problem | ||
| 1/12/2018 | Listed for rent | $1,200$2/sqft |
Source: StoneBridge Property Management Group, Inc. Report a problem | ||
| 1/5/2018 | Listing removed | $179,900$326/sqft |
Source: STONEBRIDGE REAL ESTATE GROUP #O5538075 Report a problem | ||
| 11/27/2017 | Price change | $179,900+2.9%$326/sqft |
Source: STONEBRIDGE REAL ESTATE GROUP #O5538075 Report a problem | ||
| 11/27/2017 | Pending sale | $174,900$317/sqft |
Source: STONEBRIDGE REAL ESTATE GROUP #O5538075 Report a problem | ||
| 11/3/2017 | Price change | $174,900-2.8%$317/sqft |
Source: STONEBRIDGE REAL ESTATE GROUP #O5525107 Report a problem | ||
| 10/15/2017 | Price change | $179,900-2.7%$326/sqft |
Source: STONEBRIDGE REAL ESTATE GROUP #O5525107 Report a problem | ||
| 8/16/2017 | Price change | $184,900-2.7%$335/sqft |
Source: STONEBRIDGE REAL ESTATE GROUP #O5525107 Report a problem | ||
| 7/19/2017 | Listed for sale | $190,000+74.3%$344/sqft |
Source: STONEBRIDGE REAL ESTATE GROUP #O5525107 Report a problem | ||
| 4/26/2017 | Sold | $109,000-8.4%$197/sqft |
Source: Public Record Report a problem | ||
| 3/10/2017 | Listed for sale | $119,000$216/sqft |
Source: LA ROSA REALTY, LLC #O5496806 Report a problem | ||
Public tax history
Public tax history
| Year | Property taxes | Tax assessment |
|---|---|---|
| 2024 | $3,399 +19.8% | $145,010 +10% |
| 2023 | $2,837 +16.5% | $131,827 +10% |
| 2022 | $2,435 +9.1% | $119,843 +10% |
| 2021 | $2,232 +7.9% | $108,948 +10% |
| 2020 | $2,069 +16.4% | $99,044 +38.6% |
| 2019 | $1,777 +16.4% | $71,479 +10% |
| 2018 | $1,527 | $64,981 +10% |
| 2017 | $1,527 +7.4% | $59,080 +35% |
| 2016 | $1,421 +24.4% | $43,779 +6.8% |
| 2015 | $1,142 +112.9% | $40,983 |
| 2014 | $537 +1.5% | $40,983 +44.6% |
| 2013 | $529 +1.3% | $28,345 +1.5% |
| 2012 | $522 -39.4% | $27,935 -40.6% |
| 2011 | $861 +0% | $47,037 -1.5% |
| 2010 | $861 | $47,755 -39.9% |
| 2009 | -- | $79,433 -43.4% |
| 2008 | $1,484 -4.1% | $140,356 +7.5% |
| 2007 | $1,547 +0% | $130,581 +20.3% |
| 2006 | $1,547 +3.2% | $108,519 +7.3% |
| 2005 | $1,498 +14.4% | $101,171 +19.2% |
| 2004 | $1,310 -0.3% | $84,870 +5.3% |
| 2003 | $1,314 +2.1% | $80,561 +1.1% |
| 2002 | $1,287 +1.8% | $79,672 +4.9% |
| 2001 | $1,265 +2% | $75,947 +3.8% |
| 2000 | $1,241 | $73,160 |
Find assessor info on the county website
BuyAbility℠ payment
Estimated monthly payment
All calculations are estimates and provided by Zillow, Inc. for informational purposes only. Actual amounts may vary.
HOA fees may include property taxes on listings classified as Co-Ops. Contact the listing agent and/or owner for fee details.
Mortgage interest rates are dependent on a number of factors, including credit score, down payment, and repayment length. Interest rate data provided by Zillow Group Marketplace, Inc. as of 1/1/1970 from various mortgage lenders with which we have lead or other similar arrangements; the Estimated Payment is an average of those rates.
See how much you could borrow to make a competitive offer.
Boost your down payment with 6% savings match
Earn up to a 6% match & get a competitive APY with a *. Zillow has partnered with to help get you home faster.
Learn more*Terms apply. Match provided by Foyer. Account offered by Pacific West Bank, Member FDIC.Climate risks
Neighborhood: 32808
Nearby schools
GreatSchools rating
- 4/10Pine Hills Elementary SchoolGrades: PK-5Distance: 0.3 mi
- 4/10Meadowbrook Middle SchoolGrades: 6-8Distance: 2.6 mi
- 3/10Maynard Evans High SchoolGrades: 9-12Distance: 1.5 mi

- Florida
- Orange County
- Pine Hills
- 32808
- 1000 San Domingo Rd
Nearby cities
Nearby zip codes
Other Pine Hills Topics
