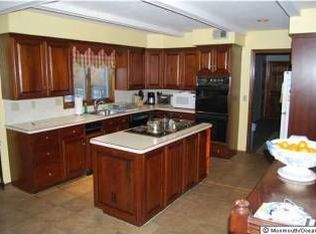
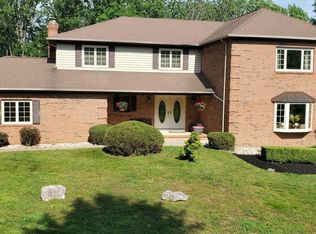
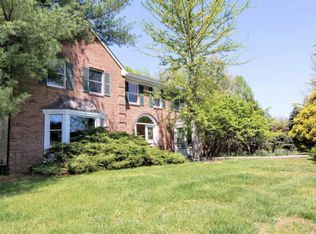
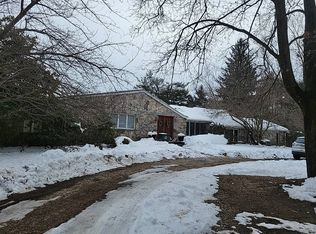
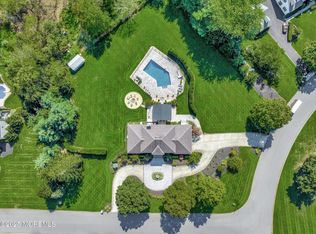
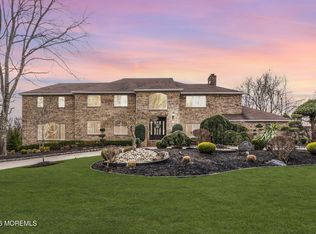
Beautiful Colonial in Prestigious KINGSBROOK ESTATES with many upgrade, located on 1.33 acres! Mostly open with some woods and attractive landscaping. Double door entry with with paver walkway with belgian block curbing. Large driveway with partial belgian block and belgian block curbing. Gorgeous Free Form POOL with New Liner. Beautiful Gourmet Granite Kitchen ( DLB Stacked Granite) all new appliances; Wolf stove, Sub Zero fridge, Miele D/W + much more. Family Room with Stunning Gas Fireplace & Wet Bar. This house is a MUST SEE to really appreciate it's beauty!
Pre-foreclosure
Est. $1,271,300
10 Red Hawk Rd S, Colts Neck, NJ 07722
4beds
3,429sqft
SingleFamily
Built in 1986
1.33 Acres Lot
$1,271,300 Zestimate®
$371/sqft
$-- HOA
Overview
- 295 days |
- 34 |
- 4 |
Facts & features
Interior
Bedrooms & bathrooms
- Bedrooms: 4
- Bathrooms: 3
- Full bathrooms: 2
- 1/2 bathrooms: 1
Heating
- Forced air, Gas
Cooling
- Central
Appliances
- Included: Dishwasher, Dryer, Refrigerator, Washer
Features
- Flooring: Hardwood
- Has fireplace: Yes
Interior area
- Total interior livable area: 3,429 sqft
Property
Parking
- Parking features: Garage - Attached
Features
- Exterior features: Other
Lot
- Size: 1.33 Acres
Details
- Parcel number: 100000600000000811
- Zoning: Single Family
Construction
Type & style
- Home type: SingleFamily
Condition
- Year built: 1986
Community & HOA
Location
- Region: Colts Neck
- Municipality: Colts Neck (COL)
Financial & listing details
- Price per square foot: $371/sqft
- Tax assessed value: $1,089,000
- Annual tax amount: $16,226
- Ownership type: Fee Simple
Visit our professional directory to find a foreclosure specialist in your area that can help with your home search.
Find a foreclosure agentForeclosure details
Estimated market value
$1,271,300
$1.18M - $1.37M
$6,057/mo
Price history
Price history
| Date | Event | Price |
|---|---|---|
| 11/29/2017 | Sold | $701,000-5.1%$204/sqft |
Source: | ||
| 9/12/2017 | Price change | $739,000-5%$216/sqft |
Source: Robert DeFalco Realty Inc. #21735696 Report a problem | ||
| 9/1/2017 | Price change | $778,000+5.3%$227/sqft |
Source: CENTURY 21 Mack-Morris Iris Lurie Inc #21705601 Report a problem | ||
| 8/5/2017 | Listed for sale | $739,000$216/sqft |
Source: CENTURY 21 Mack-Morris Iris Lurie Inc #21705601 Report a problem | ||
| 7/7/2017 | Pending sale | $739,000$216/sqft |
Source: CENTURY 21 Mack-Morris Iris Lurie Inc #21705601 Report a problem | ||
| 5/2/2017 | Price change | $739,000-5%$216/sqft |
Source: CENTURY 21 Mack-Morris Iris Lurie Inc #21705601 Report a problem | ||
| 12/19/2016 | Price change | $778,000+0.4%$227/sqft |
Source: Keller Williams - West Monmouth #21624220 Report a problem | ||
| 12/18/2016 | Price change | $775,000-1.9%$226/sqft |
Source: Keller Williams - West Monmouth #21624220 Report a problem | ||
| 9/22/2016 | Price change | $789,900-1.1%$230/sqft |
Source: Keller Williams - West Monmouth #21624220 Report a problem | ||
| 7/24/2016 | Price change | $799,000-2.5%$233/sqft |
Source: Keller Williams - West Monmouth #21624220 Report a problem | ||
| 6/18/2016 | Listed for sale | $819,900$239/sqft |
Source: Keller Williams Realty West Monmouth #21624220 Report a problem | ||
Public tax history
Public tax history
| Year | Property taxes | Tax assessment |
|---|---|---|
| 2025 | $16,226 +9.7% | $1,089,000 +9.7% |
| 2024 | $14,785 +5% | $992,300 +9.7% |
| 2023 | $14,080 +3.6% | $904,900 +10.6% |
| 2022 | $13,589 +2.7% | $818,100 +8% |
| 2021 | $13,229 +7.3% | $757,700 +4.4% |
| 2020 | $12,329 -4.9% | $725,700 +3.7% |
| 2019 | $12,961 | $700,100 -4.1% |
| 2018 | $12,961 +9% | $730,200 +0.8% |
| 2017 | $11,892 -1.5% | $724,300 +5.4% |
| 2016 | $12,074 +4.1% | $687,000 -1.3% |
| 2015 | $11,598 +4.3% | $695,900 +1.2% |
| 2014 | $11,124 +3.1% | $687,500 |
| 2013 | $10,794 +1.2% | $687,500 |
| 2012 | $10,663 +0.9% | $687,500 |
| 2011 | $10,567 -5.1% | $687,500 |
| 2010 | $11,133 +0.6% | $687,500 +98.4% |
| 2009 | $11,064 | $346,600 |
| 2008 | -- | $346,600 |
| 2007 | -- | $346,600 |
| 2006 | -- | $346,600 |
| 2005 | -- | $346,600 +4.1% |
| 2003 | -- | $333,100 |
| 2002 | -- | $333,100 |
| 2001 | -- | $333,100 |
Find assessor info on the county website
BuyAbility℠ payment
Estimated monthly payment
All calculations are estimates and provided by Zillow, Inc. for informational purposes only. Actual amounts may vary.
HOA fees may include property taxes on listings classified as Co-Ops. Contact the listing agent and/or owner for fee details.
Mortgage interest rates are dependent on a number of factors, including credit score, down payment, and repayment length. Interest rate data provided by Zillow Group Marketplace, Inc. as of 1/1/1970 from various mortgage lenders with which we have lead or other similar arrangements; the Estimated Payment is an average of those rates.
See how much you could borrow to make a competitive offer.
Boost your down payment with 6% savings match
Earn up to a 6% match & get a competitive APY with a *. Zillow has partnered with to help get you home faster.
Learn more*Terms apply. Match provided by Foyer. Account offered by Pacific West Bank, Member FDIC.Climate risks
Neighborhood: 07722
Nearby schools
GreatSchools rating
- NAConover Road Primary SchoolGrades: PK-2Distance: 1.6 mi
- 7/10Cedar Drive Middle SchoolGrades: 6-8Distance: 2.3 mi
- 5/10Colts Neck High SchoolGrades: 9-12Distance: 3.6 mi

- New Jersey
- Monmouth County
- Colts Neck Township
- 07722
- 10 Red Hawk Rd S
Nearby cities
Nearby zip codes
Other Colts Neck Township Topics
- Apartments for Rent in 07722
- Houses for Sale in 07722
- Houses for Rent in 07722
- 07722 Real Estate
- Colts Neck Township Condos
- Houses for Sale in Colts Neck Township
- Newest Listings in Colts Neck Township
- Colts Neck Township Home Values
- Colts Neck Township Real Estate Agents
- Colts Neck Township Refinance
- Colts Neck Township Mortgage Rates
